
The trend of processors spending less on replacement parts continues to grow, according to Food Engineering’s 2018 Replacement Parts and Components Trends Survey.
This year’s survey revealed that 57 percent of respondents say their company spends less than $100,000 per year on replacement parts. That’s up from the 2017 total of 52 percent. The trend has grown significantly in the last few years; in 2014, only 32 percent said their company spent less than $100,000 on replacement parts.
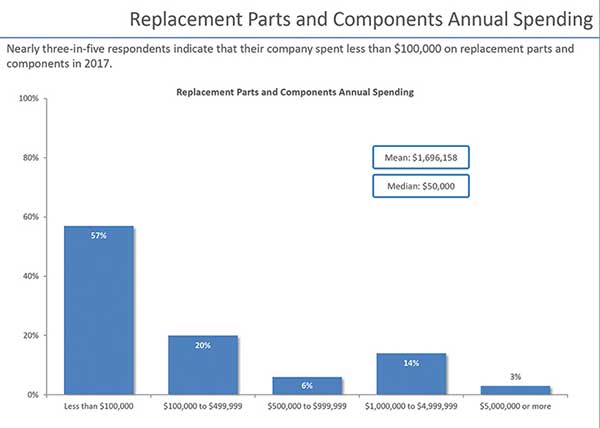
The survey also found that 17 percent of respondents spend more than $1 million a year on replacement parts, with 14 percent spending $1 million to $5 million, and 3 percent spending more than $5 million per year. The mean spending on replacement parts was $1,696,158, and the median was $50,000.
The survey, conducted by Food Engineering and its parent company BNP Media’s Market Research Division, asked our readers for their insights in an effort to provide detailed information on the latest methods to improve efficiency in buying replacement parts and components.
The key objectives for this study were to identify:
- The type of job functions involved in replacement parts and components decisions
- Information about replacement parts and components that industry professionals rely on
- The most important factors when selecting a supplier
- The maintenance replacement strategies and inventory management practices that are currently utilized.
The full report can be purchased at www.clearmarkettrends.com, but below is a look at some of the most noteworthy findings.
Making the decisions
The maintenance department was the most common response to the question of who makes decisions on replacement parts, with 26 percent of respondents saying that their maintenance department is responsible. Other departments included plant operations (18 percent) and general administration/executive management (15 percent). Engineering was close behind at 14 percent.
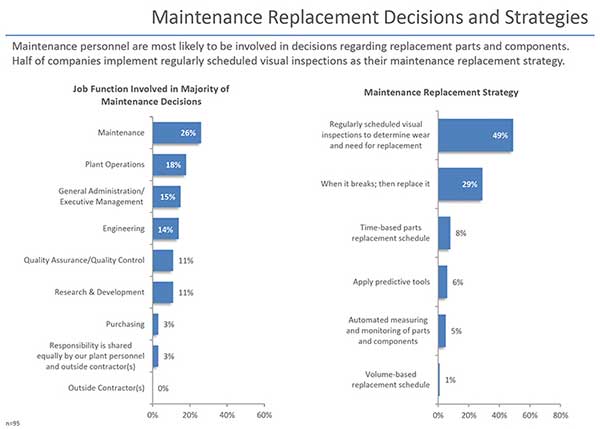
When it comes to maintenance replacement strategies, almost half (49 percent) of respondents say they conduct regular visual inspections to determine when parts need to be replaced, down from 55 percent last year. But 29 percent of respondents say they wait until something breaks before they replace it, up from 24 percent last year.
There was a big jump in respondents saying they use automated measuring and monitoring of parts and components, but it’s still a pretty small group overall. This year, 5 percent of respondents say they use automated measuring and monitoring, up from only 1 percent last year.
Replacement parts cost and where they come from
In last year’s survey, 47 percent of respondents said they saw the value of purchasing higher-priced parts because of the overall ROI. But that number dropped to 40 percent this year and was surpassed by 41 percent of respondents saying, “Most parts are commodities, with price the determining factor when specifying replacements.” Manpower shortages led 13 percent to say that they have no choice but to specify the highest-quality available parts to ensure the longest mean time to failure.
When it comes to determining where to buy parts, 4 percent of respondents say they only use OEM parts. Of those who use non-OEM parts, 37 percent say they don’t work as well as higher-priced parts, and 34 percent say they experienced premature machine failures with non-OEM parts. Another 12 percent say they may have received counterfeit parts. In contrast, 27 percent say less expensive parts work just as well as OEM parts.
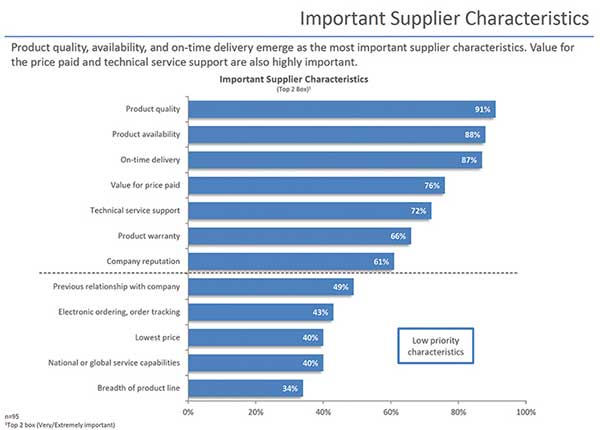
When it comes to picking a supplier, 91 percent of respondents chose product quality as one of their top two criteria, and 88 percent chose product availability. Close behind was on-time delivery, which was a top two choice for 87 percent of respondents. Value was the fourth-most popular choice, with 76 percent of respondents choosing it. Only 40 percent chose lowest price.
As for ordering parts, 62 percent of respondents use automation; that’s almost unchanged from last year’s 61 percent. Interestingly, last year’s most popular method of automated ordering was CMMS (21 percent), but it’s fallen to third in this year’s survey, at 17 percent. Using standardized hard copy purchase orders (22 percent) is the most popular option, with 19 percent choosing system-generated purchase orders.
Inventory practices
Inventory practices have seen some changes over the last year, with only 61 percent of respondents saying they’ve had no change, compared to 2017’s 67 percent. Twenty-four percent of respondents say they are increasing their replacement parts inventory, up from only 14 percent last year. Fifteen percent say they are reducing their replacement parts inventory, down from 19 percent last year.
Only 36 percent of respondents say they have an MRO cost-cutting strategy. Among the methods mentioned are a min/max inventory system and receiving discounts by bundling purchases, ordering larger quantities or leveraging multi-plant purchases.
About two-thirds (64 percent) track inventory dollar value to improve inventory management, and less than half (45 percent) track turns. About a quarter (24 percent) chose insufficient funding to organize and streamline inventory practices as the greatest challenge to minimizing replacement parts inventory.
When it comes to innovation opportunities, respondents say they’re looking for more automation, better integration both internally and with vendors, and wireless options. Searchable databases and automatic ordering were mentioned as specific opportunities, as were equipment intelligence to report out-of-spec data and more cloud-based tools.
Please visit www.clearmarkettrends.com to purchase and download the entire report as well as access a wide inventory of other studies done in this industry. You can also email info@clearmarkettrends.com with any questions.
About the survey:
The report’s statistics and comments reflect the responses of Food Engineering readers who returned mailed questionnaires or elected to complete the replacement parts survey online.
General administrative/executive management, QA/QC personnel and engineering professionals represent 60 percent of respondents (29 percent, 16 percent and 15 percent, respectively).
The remaining 37 percent of respondents are split between plant operations (14 percent), research and development (13 percent), maintenance (9 percent) and other (4 percent).
Less than half (45 percent) work for a company with fewer than 100 employees, while 18 percent work at a company with between 100 and 499 employees, 12 percent work at a company with 500 to 999 employees, and 24 percent work for a company with more than 1,000 employees.
The primary products produced by 17 percent of respondents are beverages, followed by bakery and snack food products (15 percent); dairy and frozen novelty products (11 percent); frozen food and prepared meals/fruits and vegetables (11 percent); corporate and divisional headquarters only (9 percent); processed meat, poultry and seafood products (9 percent); co-packer/co-manufacturer of food and beverage (8 percent); dietary supplements, chemicals and food ingredient products (8 percent); shelf-stable foods/soups, sauces, jams and jellies (5 percent); cereal and grain-based products (4 percent); and candy, sugar and confectionery products (2 percent).


