9th Annual Replacement Parts Survey
Food Engineering readers provide insight into how their companies are recalibrating inventory needs to meet production demands.
 Replacement parts management isn’t off limits for lean initiatives, and food and beverage companies increasingly are taking a critical look at inventory practices. But instead of slashing inventories, those reviews sometimes result in boosting the supply of parts on hand or outsourcing responsibilities.
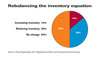
Complacency is out and reassessment of inventory practices is in, respondents to this year’s Food Engineering Replacement Parts and Components survey make clear. Whereas only 38 percent of participants in last year’s survey said changes had been made in the previous year, fully half of this year’s respondents report altered inventory practices. And change didn’t necessarily mean fewer replacement parts were on hand: One in seven (14 percent) say inventories are increasing, double the proportion of a year ago. Inventory reductions are occurring at 36 percent of the plants, up from 31 percent a year ago.
 Financial factors drove many of the scale-backs, though other considerations also are being calculated. “As we work toward reliability, we don’t need to stock as many parts,” one Food Engineering reader writes. “Moving towards VMI (vendor-managed inventory) for many high use items,” another explains. “We are trying to keep minimum quantities as a part of lean manufacturing,” adds a third. One in four opts to outsource parts management to a local supply house.
A focus on overall equipment efficiency dictates many of the inventory expansions, along with the arrival of new machinery. A variety of other factors also are at play. “We have increased our inventory based on parts becoming obsolete for older machinery,” says one respondent, while several cite longer order-fulfillment lead times, forcing them to stock up. One reader suggests larger inventories are a hedge against price inflation, noting his company is “trying to stock parts that are increasing in cost.”
Don’t fix what’s not broken is the guiding principle for many who are sticking with the status quo. For others, automation or the lack of it dictates that they stand pat. At one firm, next-day delivery of needed parts is necessary due to a shortage of storage space. “We need a better parts-management system, but the cost to do so inhibits us,” a manufacturing professional writes. At another company, inventory levels are steady despite an influx of new equipment because “we expect the new computer system to have enough information to track/order parts based on usage,” the reader explains.
“One to show, one to go” is a retailing maxim, and a manufacturing variation of it is found at many parts cribs. In response to a survey question on the greatest challenges to streamlining inventories, one reader notes, “Eliminating old paradigm of always having a spare on hand for everything.” One in five indicates insufficient funding to reorganize inventory practices is the biggest deterrent to overhauling inventory practices, closely followed by the absence of a searchable parts database. Multiple sourcing options, inconsistent parts names, absence of coordination between multiple plant locations and a lack of management continuity also disrupt streamlining initiatives.
The survey presents five approaches to MRO inventory practices and asks participants which ones they leverage. Vendor-managed inventories were cited by three out of five, making it the most common practice. Consignment was the least common MRO practice, but it demonstrated the greatest relative growth (50 percent) year to year, with three in 10 relying on it.
When companies set out to improve inventory management, inventory dollar value is the metric of choice for more than two-thirds. Turns are falling out of favor, with only 46 percent using this measure, down 10 points from a year ago.
Alternatives to run-to-failure include replacing components based on time of service or volume of production, though only one in eight uses those approaches. Automated monitoring of component performance remains a blip on the application chart.
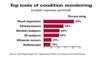
Only one in 10 readers indicates the employment of predictive tools such as vibration analysis, a figure at odds with the answers to a question regarding condition monitoring. Presented with a list of six condition-monitoring tools, more than half say they use one or more of them. Infrared sensors are in use at more than half the plants, with vibration and oil analyzers deployed at two out of five. Stethoscopes, ultrasonic sensors and thermal imaging are among the other tools used. See related chart on page 20.
Parts ordering is more automated today than at any time in the survey’s nine-year history, with almost half indicating they utilize system-generated purchase orders or system-generated parts requirements. In contrast, about one-quarter are completely dependent on manual order systems, the lowest level ever recorded. Real-time data links to parts suppliers or distributors remain a rarity.
Similarly, few plants permit their suppliers to conduct remote diagnostics of machine conditions. Security concerns and a reluctance to provide third parties with a view to internal operations trump the benefit of warnings of impending machine failure for seven out of eight companies. Virtually all of those taking advantage of remote diagnostics relay the information to maintenance and parts-ordering personnel.
Lowest price is almost always the least important consideration when purchasing replacements. On the other hand, a decision to purchase premium parts requires financial justification. Half the respondents maintain they have quantified maintenance costs for most of their plant’s machinery and can calculate the ROI on premium parts, easily the highest proportion in the five years the question has been posed. Only a third consider most parts to be commodities, the lowest level in five years.
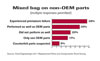
Almost two in five respondents report premature wear and machine failures occurred as a consequence of using non-OEM replacement parts, and almost one in five use OEM parts exclusively. But most take a nuanced approach, and a growing proportion agrees with the reader who writes, “will use parts other than OEM, but they must be of good quality.” Increasingly, manufacturers are experiencing positive outcomes with non-OEM components. Only one in five agrees with the statement, “less expensive parts do not work as well,” the lowest proportion since the question was first posed and half the level in 2008. Three in 10 believe less expensive parts are on par with OEM parts, up sharply from prior years. The ratio of OEM-only parts buyers is at its lowest level.
Experiences vary from manufacturer to manufacturer and from part to part, as several readers point out. “Non-OEM parts caused major reprogramming of PLC to get it to work,” one respondent writes. Another indicates more positive outcomes. “Usually, if we use non-OEM parts, it is an upgrade from the original,” the reader notes.
The World Wide Web’s role in expediting purchases continues to grow, with three in five readers saying they have purchased directly from manufacturer and distributor websites in the previous six months, double the proportion four years ago. Fewer than one in four say they have not made an on-line purchase and do not intend to do so in the next six months, half the Web-averse rate eight years ago.
Since 2005, readers have been asked which job functions are involved in the majority of maintenance decisions. Maintenance personnel consistently have been cited as the most-frequent decision-makers in slightly more than half the plants, while plant-operations professionals consistently are cited in one-sixth to one-eighth of the responses. The job functions demonstrating the greatest change are engineering, where only one in 10 now is involved (half the 2005 ratio), and purchasing, which is involved in 6 percent of decisions (double the 2005 ratio).
This year’s respondents work at plants somewhat smaller than last year’s sample, a factor in the 12 percent drop in average annual spending on replacement parts and components to $1,454,702. Overall, respondents’ facilities spent $230 million last year on parts.
Consistent with previous replacement parts surveys, engineers constitute almost a quarter of the respondents, edging out maintenance professionals, who represent 22 percent of the base. Almost one in five is engaged in plant operations or administrative/executive duties, and 10 percent are involved in purchasing. The remainder are scattered among R&D and QA responsibilities.
Two-thirds work at plants with 100-499 employees, a slightly higher proportion than in previous surveys. Conversely, one in four represents plants with 500 or more workers, down marginally from previous years. One in 10 works at facilities with fewer than 100 staffers.
Meat, poultry or seafood is the primary product at a sixth of the sites, closely followed by bakery and snack products, beverages, frozen and prepared meals and dairy products. One-third of survey participants work at facilities producing food products in six other categories.
Complacency is out and reassessment of inventory practices is in, respondents to this year’s Food Engineering Replacement Parts and Components survey make clear. Whereas only 38 percent of participants in last year’s survey said changes had been made in the previous year, fully half of this year’s respondents report altered inventory practices. And change didn’t necessarily mean fewer replacement parts were on hand: One in seven (14 percent) say inventories are increasing, double the proportion of a year ago. Inventory reductions are occurring at 36 percent of the plants, up from 31 percent a year ago.
A focus on overall equipment efficiency dictates many of the inventory expansions, along with the arrival of new machinery. A variety of other factors also are at play. “We have increased our inventory based on parts becoming obsolete for older machinery,” says one respondent, while several cite longer order-fulfillment lead times, forcing them to stock up. One reader suggests larger inventories are a hedge against price inflation, noting his company is “trying to stock parts that are increasing in cost.”
Don’t fix what’s not broken is the guiding principle for many who are sticking with the status quo. For others, automation or the lack of it dictates that they stand pat. At one firm, next-day delivery of needed parts is necessary due to a shortage of storage space. “We need a better parts-management system, but the cost to do so inhibits us,” a manufacturing professional writes. At another company, inventory levels are steady despite an influx of new equipment because “we expect the new computer system to have enough information to track/order parts based on usage,” the reader explains.
“One to show, one to go” is a retailing maxim, and a manufacturing variation of it is found at many parts cribs. In response to a survey question on the greatest challenges to streamlining inventories, one reader notes, “Eliminating old paradigm of always having a spare on hand for everything.” One in five indicates insufficient funding to reorganize inventory practices is the biggest deterrent to overhauling inventory practices, closely followed by the absence of a searchable parts database. Multiple sourcing options, inconsistent parts names, absence of coordination between multiple plant locations and a lack of management continuity also disrupt streamlining initiatives.
The survey presents five approaches to MRO inventory practices and asks participants which ones they leverage. Vendor-managed inventories were cited by three out of five, making it the most common practice. Consignment was the least common MRO practice, but it demonstrated the greatest relative growth (50 percent) year to year, with three in 10 relying on it.
When companies set out to improve inventory management, inventory dollar value is the metric of choice for more than two-thirds. Turns are falling out of favor, with only 46 percent using this measure, down 10 points from a year ago.
Diagnostics beyond eyes
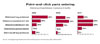
Regular visual inspection remains the most frequent trigger for replacing worn components, though it is on the wane: Slightly less than half of respondents indicate visual inspections best described their plants’ replacement strategy, compared to 70 percent in 2004. On the other hand, visual inspections are routinely performed at the vast majority of facilities. Wait until they break is the strategy of choice at three in 10 facilities, the highest level ever recorded in the survey.Alternatives to run-to-failure include replacing components based on time of service or volume of production, though only one in eight uses those approaches. Automated monitoring of component performance remains a blip on the application chart.
Only one in 10 readers indicates the employment of predictive tools such as vibration analysis, a figure at odds with the answers to a question regarding condition monitoring. Presented with a list of six condition-monitoring tools, more than half say they use one or more of them. Infrared sensors are in use at more than half the plants, with vibration and oil analyzers deployed at two out of five. Stethoscopes, ultrasonic sensors and thermal imaging are among the other tools used. See related chart on page 20.
Parts ordering is more automated today than at any time in the survey’s nine-year history, with almost half indicating they utilize system-generated purchase orders or system-generated parts requirements. In contrast, about one-quarter are completely dependent on manual order systems, the lowest level ever recorded. Real-time data links to parts suppliers or distributors remain a rarity.
Similarly, few plants permit their suppliers to conduct remote diagnostics of machine conditions. Security concerns and a reluctance to provide third parties with a view to internal operations trump the benefit of warnings of impending machine failure for seven out of eight companies. Virtually all of those taking advantage of remote diagnostics relay the information to maintenance and parts-ordering personnel.
Balancing quality and cost
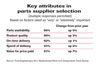
The quality of parts always ranks high when sourcing replacements, though product quality looms larger in importance this year, relative to a dozen other considerations. On a five-point scale, component quality’s average score is 4.53. On-time delivery is next at 4.49, though slightly more readers rate on-time delivery as very or extremely important (96 percent, compared to 95 percent for quality). Product availability, speed of delivery and value for price paid also are highly rated attributes.Lowest price is almost always the least important consideration when purchasing replacements. On the other hand, a decision to purchase premium parts requires financial justification. Half the respondents maintain they have quantified maintenance costs for most of their plant’s machinery and can calculate the ROI on premium parts, easily the highest proportion in the five years the question has been posed. Only a third consider most parts to be commodities, the lowest level in five years.
Almost two in five respondents report premature wear and machine failures occurred as a consequence of using non-OEM replacement parts, and almost one in five use OEM parts exclusively. But most take a nuanced approach, and a growing proportion agrees with the reader who writes, “will use parts other than OEM, but they must be of good quality.” Increasingly, manufacturers are experiencing positive outcomes with non-OEM components. Only one in five agrees with the statement, “less expensive parts do not work as well,” the lowest proportion since the question was first posed and half the level in 2008. Three in 10 believe less expensive parts are on par with OEM parts, up sharply from prior years. The ratio of OEM-only parts buyers is at its lowest level.
Experiences vary from manufacturer to manufacturer and from part to part, as several readers point out. “Non-OEM parts caused major reprogramming of PLC to get it to work,” one respondent writes. Another indicates more positive outcomes. “Usually, if we use non-OEM parts, it is an upgrade from the original,” the reader notes.
The World Wide Web’s role in expediting purchases continues to grow, with three in five readers saying they have purchased directly from manufacturer and distributor websites in the previous six months, double the proportion four years ago. Fewer than one in four say they have not made an on-line purchase and do not intend to do so in the next six months, half the Web-averse rate eight years ago.
Since 2005, readers have been asked which job functions are involved in the majority of maintenance decisions. Maintenance personnel consistently have been cited as the most-frequent decision-makers in slightly more than half the plants, while plant-operations professionals consistently are cited in one-sixth to one-eighth of the responses. The job functions demonstrating the greatest change are engineering, where only one in 10 now is involved (half the 2005 ratio), and purchasing, which is involved in 6 percent of decisions (double the 2005 ratio).
This year’s respondents work at plants somewhat smaller than last year’s sample, a factor in the 12 percent drop in average annual spending on replacement parts and components to $1,454,702. Overall, respondents’ facilities spent $230 million last year on parts.
Who answered the survey?
Feedback from readers of Food Engineering provides the basis for information in the Ninth Annual Replacement Parts and Components report. A combination of mailed surveys and e-mail invitations to respond on-line was sent in early February to magazine subscribers whose professional duties include plant operations, engineering, general administration and purchasing.Consistent with previous replacement parts surveys, engineers constitute almost a quarter of the respondents, edging out maintenance professionals, who represent 22 percent of the base. Almost one in five is engaged in plant operations or administrative/executive duties, and 10 percent are involved in purchasing. The remainder are scattered among R&D and QA responsibilities.
Two-thirds work at plants with 100-499 employees, a slightly higher proportion than in previous surveys. Conversely, one in four represents plants with 500 or more workers, down marginally from previous years. One in 10 works at facilities with fewer than 100 staffers.
Meat, poultry or seafood is the primary product at a sixth of the sites, closely followed by bakery and snack products, beverages, frozen and prepared meals and dairy products. One-third of survey participants work at facilities producing food products in six other categories.
Looking for a reprint of this article?
From high-res PDFs to custom plaques, order your copy today!


