The State of Food Manufacturing
2016 State of Food Manufacturing shows increased sales, food safety issues
Good news: Sales are up. Bad news: That means more pressure from consumers, and increasing output.

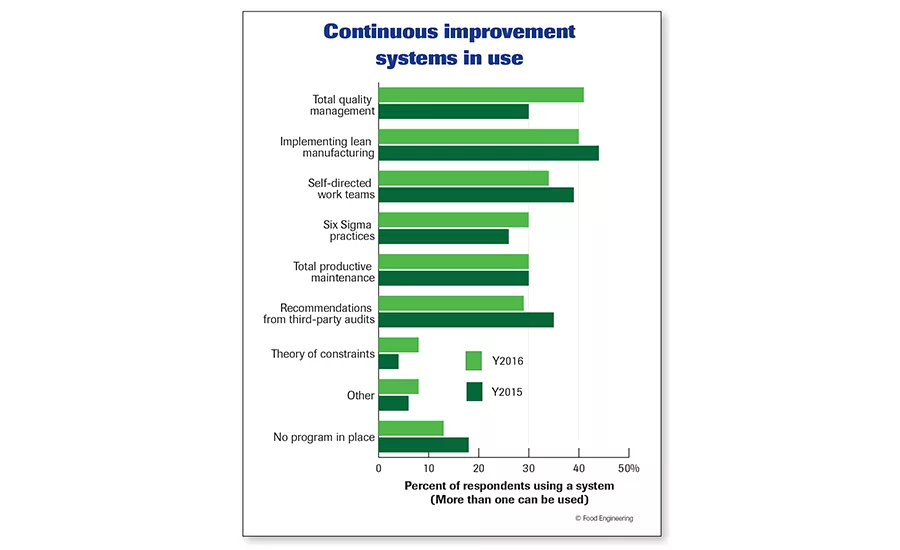
Total quality management is the most reported continuous improvement system in use in 2016, reported at 41 percent. In 2015, those implementing lean manufacturing represented the highest number at 44 percent. Source: FE’s 2016 State of Food Manufacturing Survey.

The overall percentage of budget for production, packaging and process control equipment; software; and professional services has increased slightly in 2016 from the previous year. Source: FE’s 2016 State of Food Manufacturing Survey.

In 2016, 57 percent of respondents expect their location gross throughput to increase by 14 percent compared to 2015; in 2015, 71 percent expected their throughput to increase by 14 percent compared to 2014. In 2016, 60 percent of respondents expect their company’s gross throughput to increase by 13 percent compared to 2015; in 2015, 70 percent expected an increase of 13 percent compared to 2014. Source: FE’s 2016 State of Food Manufacturing Survey.
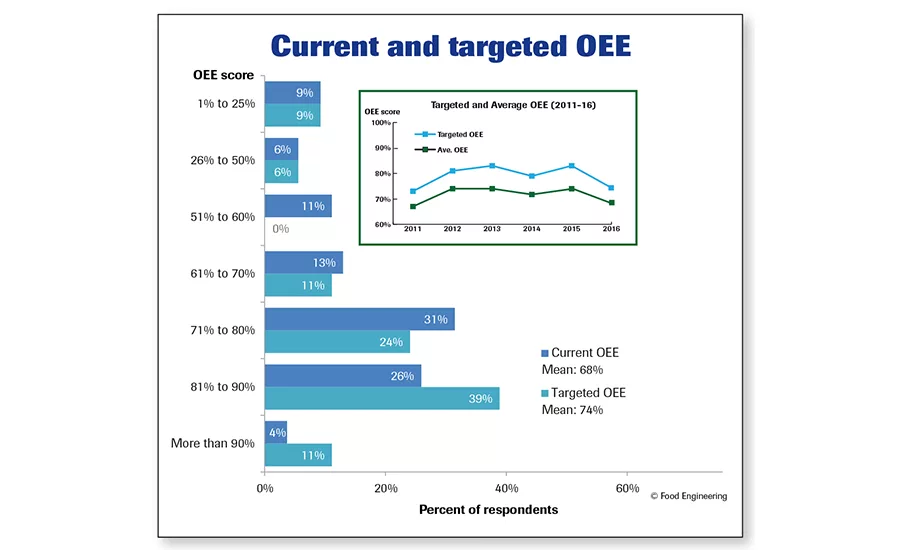
On average, processors targeted an overall equipment effectiveness of 74 percent on average, but report 68 percent as their current OEE. While 39 percent of respondents targeted an OEE of 81 to 90 percent, only 26 percent realized an OEE score in that range. Both target and actual scores decreased significantly this year. Source: FE’s 2016 State of Food Manufacturing Survey.
See the latest State of Food Manufacturing survey
At first glance, it might seem like the results of this year’s Annual State of Food Manufacturing Survey are very similar to last year’s, but delving further into the data belies that assumption. Further scrutiny of some of the statistics would seem to reveal that some food and beverage processors are so concerned with getting product out the door that OEE and food safety have taken a back seat to production demands—at least, that’s what the numbers seem to portray.
Article Index:
- What’s driving throughput?
- Budgets up slightly for equipment and services
- You can’t control what you don’t measure
- A few surprises related to automation
- Steps to increase output and productivity
- Food safety and social programs
- Who participated in this year’s survey?
Of course, these priorities seem a little discombobulated, but perhaps the data reveals some other facts. For example, some processors responding to this year’s survey may have already implemented certain food safety management programs and/or automation and asset management systems such that they have changed budget priorities—that is, spending in other key areas that they had not previously budgeted. But, at the same time, OEE numbers have taken a nose dive—not exactly what would be expected if processors have their production systems in control to manage the increased workflow demands. Let’s take a deeper dive into the results of this year’s survey.
What’s driving throughput?
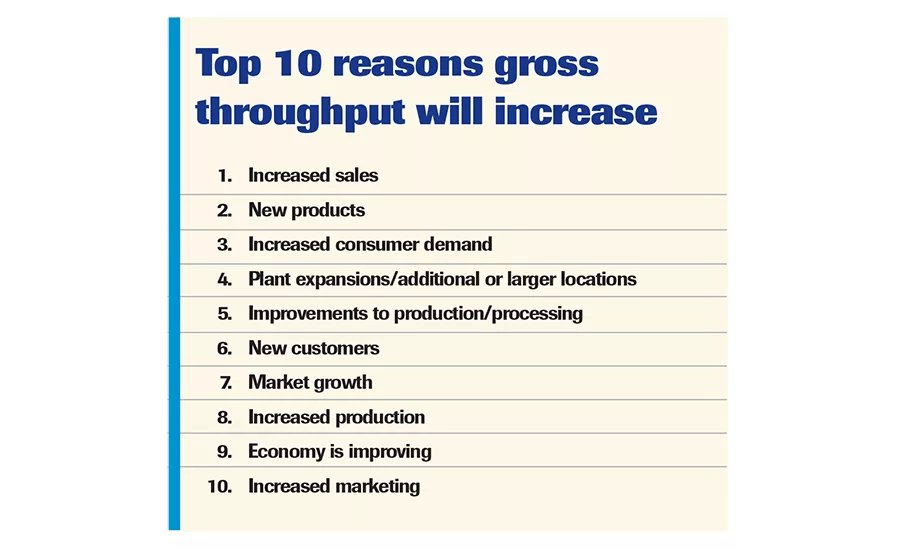
In last year’s State of Food Manufacturing Survey (2015), the top factor driving increased throughput, according to respondents, was the creation of new products and lines, which might seem a little like putting the cart before the horse. Not in this year’s survey. Food and beverage processors resoundingly cite increased sales and new products, followed by increased consumer demand, as what’s pushing their efforts to grow their businesses. New customers and market growth are adding to the frenzy of needing to increase throughput. For example, one QA/QC manager says that his company is expecting increased revenues from markets such as China, India and Saudi Arabia.
With today’s Millennial generation and the desire for “better-for-you” foods, processors are seeing a growing demand for non-GMO and allergen-free products. One corporate manager reports an increased demand for non-GMO products from his facility, and a plant operations manager says the demand for organic products is growing at his company, while yet another corporate manager sees an ever-increasing demand for its niche product line, which he’s not revealing for obvious reasons.
In meeting these demands, processors are expanding their plants and building additions, and when those efforts no longer fill the bill, it’s a push to find larger sites that will allow them to increase manufacturing space without being hemmed in. Thinking back to several FE plant-of-the-year projects, by the time their stories appeared in print, they were already expanding their facilities because they planned ahead with additional open property to be developed and floor plans that allowed the pushing out of a wall to add an expansion. As one engineer points out, investments in infrastructure are helping his company increase production, while one plant operations manager says his company has recently had two large renovations.
Processors are also making improvements to production and processing methods and deciding how to increase their capabilities. Automation and new equipment purchases are helping to keep up with throughput while processors scramble to find qualified employees and increase distribution channels. Manufacturers have also stepped up buying of raw materials and are improving raw material yields. To improve performance and efficiency, one processor reports using key performance metrics (KPMs) to get a handle on weak links in the production system.
With all this excitement about increased product demands, fewer processors see an increase of throughput compared to last year. More than half (57 percent) of respondents believe that during this year gross throughput at their location will increase compared to 2015, by 14 percent on average. Last year, nearly three-quarters (71 percent) expected to see a gross throughput increase of 14 percent compared to 2014. This year, 37 percent of processors expect to see throughput remain the same as it did in 2015; in 2015, only 24 percent of processors expected to see throughput remain the same as it did in 2014.
Company-wide (as opposed to a single location) results on expected throughput in 2016 compared to 2015—and 2015 compared to 2014—are very similar to location expectations covered in the preceding paragraph. Three-in-five respondents believe 2016 gross throughput at their company will increase compared to 2015, on average by 13 percent. In 2015, 76 percent expected to see their company-wide throughput increase by an average of 13 percent compared to 2014.
Budgets up slightly for equipment and services
To prepare for the increased product demands, slightly more processors have designated bigger chunks of their budgets this year compared to last year for expanding production equipment, according to the survey. On average, 22 percent of companies’ budgets has been designated for the purchase of production, packaging and process control equipment; software; and professional services this year, and the majority of processors have set aside less than $3 million for plant equipment. Last year, 21 percent of processors set aside less than $500,000 for these same expenditures.
Looking at these expenditures in more detail reveals that one-half of respondents report that their 2016 budget for the purchase of production, packaging and processing equipment has stayed the same compared to 2015. Just a little over half (52 percent) of last year’s respondents (2015) said their expenditures would stay the same as 2014. The good news is that even though slightly fewer than the previous year’s respondents (38 percent in 2016 compared to 42 percent in 2015) report increased expenditures for this year, the mean increase of expenditures for this year is 27 percent compared to last year’s figure of 17 percent.
The survey also broke out the budget for manufacturing automation and control hardware and software. Nearly two-thirds (63 percent) of respondents note that their 2016 budget for this category remains the same as 2015; in last year’s survey (2015), the same number (63 percent) of respondents reported their 2015 budget for this category would remain the same as 2014. Fewer respondents in 2016 (29 percent) compared to those in 2015 (34 percent) report an increase in their budgets for this category. The mean budget increase reported for 2016 is in the 10 to15 percent range, roughly the same as last year.
You can’t control what you don’t measure
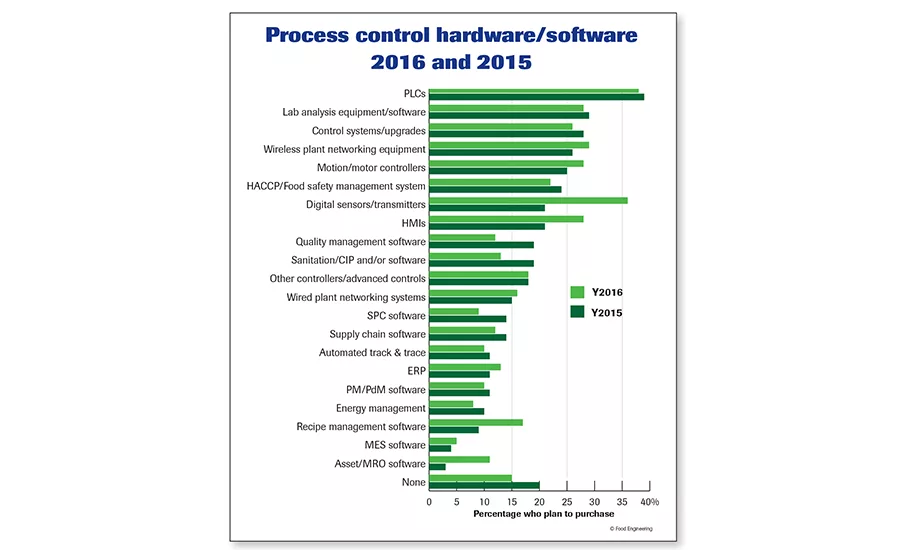
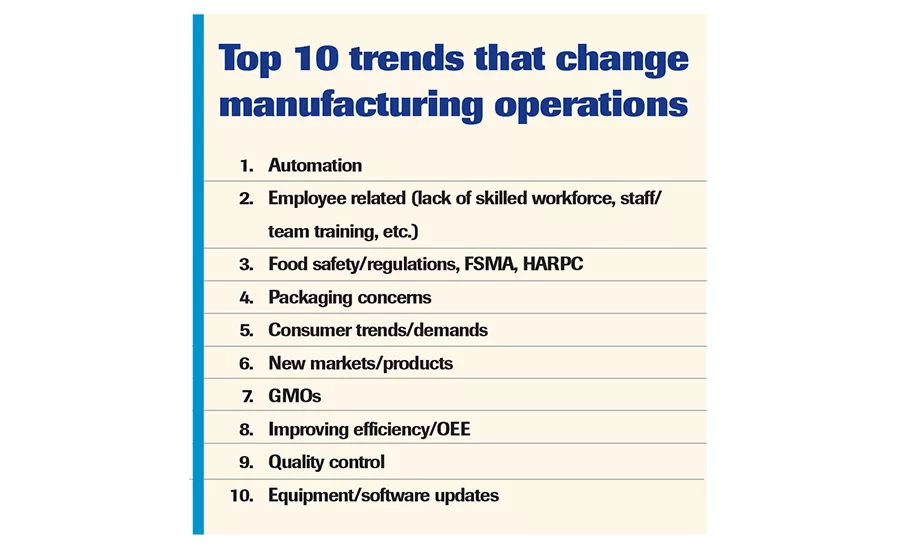
“We must automate to remain competitive,” says one plant engineer. As automation is viewed by respondents as the top trend that will change manufacturing, it comes as no surprise that continued spending on several areas of automation is either holding or increasing. Well over a third (38 percent) of respondents of this year’s State of Food Manufacturing Survey plan to purchase PLCs—a little lower than last year’s figure of 39 percent. What’s more telling is that processors now understand the age-old process control axiom, “You can’t control what you don’t measure.” In light of this, 36 percent of this year’s respondents plan to purchase digital sensors and transmitters, up from last year’s number of just 21 percent.
And within some facility locations, getting the signal from the sensor to the PLC is somewhat easier using wireless networking, especially if it’s exceedingly difficult to run new wires in an old facility or wires that might be exposed to harsh cleaning fluids. One plant operations manager has looked to wireless control systems as a big solution to automating. This year, 29 percent of survey respondents are planning to purchase wireless plant networking equipment. While wired systems are still important, only 16 percent of respondents plan to buy them. Could a reason be that many processors already have wired networks installed and want to put in wireless systems for those impossible-to-wire locations?
Getting a handle on the process is vitally important. As one production manager says, it’s time to get rid of paper recipes and commit them to software systems. Not surprisingly, there is some agreement, and this year, 17 percent of processors say they will invest in recipe management software—almost double last year’s figure of just 9 percent. Being able to present a view of the process to the operator is the job of the HMI, and processors are interested in increasing their ability to see their process stats. Therefore, 28 percent of respondents say they will purchase HMIs this year compared to 21 percent in 2015—a gain of 33 percent.
In 2015, those spending money on asset management systems and/or MRO accounted for only 3 percent of total respondents—not many, considering that keeping production systems up and running without surprise downtime makes good business sense. According to one QA/QC manager, being able to quantify downtime in percentage points is important. Indeed, this year, 11 percent of respondents (almost four times that of 2015) say they will be purchasing asset management software and/or MRO systems. Asset management systems, coupled with sensors in the right places, can save processors unexpected downtime as these systems are capable of predicting degradation of an asset like a motor or bearing and alerting of potential failure before that catastrophic event happens.
A few surprises related to automation
Some survey results indicate projected process control hardware and software purchases for this year are lower than last year’s. The reason could be due to margin of error or, that in some categories, processors have actually caught up with purchases and feel the need to direct their purchasing budgets in other directions. For example, in 2015, 14 percent of respondents planned to purchase statistical process control (SPC) software; this year, only 9 percent plan to purchase SPC software. At this point, one might conclude that SPC is becoming a mature product category—i.e., SPC is probably in the first group of software purchases a processor is likely to make. The same might be said for quality management systems (QMS) software. In 2015, 19 percent of survey respondents planned to purchase QMS software; this year, the number has dwindled to 12 percent. However, investments in lab analysis equipment and software have remained nearly the same as last year; 28 percent of respondents plan to buy this category, down slightly from the 39 percent recorded in 2015.
Another example is the category of sanitation/CIP systems and/or software. The percentage of respondents planning CIP-related purchases this year is 13 percent of total; last year, the number was 19 percent of total respondents. In many cases, CIP is now part of the total control system and is often included as a step in recipe management systems. Therefore, the purchase of CIP-specific software is probably redundant as other control systems can integrate CIP as part of the process. Other comparisons between last year and this year’s proposed spending in categories where there was a 1 or 2 percent difference can probably be chalked up to margin of error. However, it’s safe to say that it’s easy to spot that the largest areas for spending remain in automation.
The real surprise comes with the OEE numbers reported by food and beverage processors responding to this year’s State of Food Manufacturing Survey. On average, companies have targeted an overall equipment effectiveness (OEE) score of 74 percent, but report 68 percent as their current OEE. These numbers have taken a significant dip compared to the last four years and are about the same low as they were in 2011 (see graph). It’s normal to expect targeted scores to be higher than realized average scores, but even targeted scores are lower than they’ve been for five years.
It’s not like people aren’t thinking about OEE; after all, it was number eight in our manufacturing trends list. One operations manager suggests that increased automation would allow his company to become more efficient—increasing its OEE. One engineer notes, “To be best in class, we have to improve operational efficiency.” Another manufacturing engineer calls out for an increased emphasis on OEE utilization. A plant operations manager notes that his company needs to be tracking not just line efficiency, but OEE. But will throwing more automation at a problematic line increase OEE? While it’s great to have high OEE numbers, one plant manager notes that to achieve higher OEE scores, there has to be more emphasis on employees’ understanding what OEE is and how to improve it. This all goes back to the second-hottest issue in the top 10 trends—skilled employees: finding, keeping and educating them. (For more on the issue, see FE, September 2016 Manufacturing News.)
Steps to increase output and productivity
Not surprisingly, in the past year, over a third of food and beverage companies have added manufacturing staff (38 percent), expanded/renovated/added capacity to their existing plants (37 percent) and/or have added a new line (36 percent). Three in 10 companies have changed a process, 24 percent have added production shifts, and 20 percent have installed advanced automation systems. In fact, the first four activities were also the top four reported in FE’s 2015 survey, though in slightly different order. In 2016, 9 percent of respondents report consolidating manufacturing facilities compared to 16 percent the year before. One other notable change—and may be due to processors wanting to maintain tighter quality control and food safety—is that last year, 24 percent of respondents reported outsourcing work. In this year’s survey, only 6 percent say they are outsourcing work.
FE’s survey asked processors about improving productivity and packaging operations, and the first two responses in each category are the same as last year. In terms of improving productivity, equipment upgrades (88 percent of total respondents) present the greatest need overall to respondents’ companies. But training is a close second! Improving skills training of line operators (82 percent) and/or line supervisors (80 percent) are the second- and third-most needed capabilities. These three categories in the 2015 survey represented 89, 83 and 79 percent, respectively, in the same categories.
In order to improve packaging operations, nearly half of respondents’ companies are changing out/upgrading equipment (47 percent) and/or training operators, involving them in maintenance and improvements (47 percent). These same categories were both 45 percent last year, representing a slightly greater need this year. Engineers report making packaging platform changes—one example is a completely new implementation of a new type of packaging and filling system going into operation in 2017. One engineer reports consolidating lines. “With a new packaging platform, we will be consolidating two lines into one.” A plant manager reports adding production lines in an under-equipped plant. A plant operations manager reports making production tracking improvements as better information allows for communication of opportunities and successes.
Some other productivity improvement needs include:
- Improving maintenance systems
- Monitoring of key performance indicators (KPIs)
- Increasing flexibility on existing lines
- Enhancing communications between manufacturing levels/areas
- Improving supply chain management.
Additional improvements to packaging operations include the following activities:
- Increase throughput
- Decrease changeover times
- Decrease energy usage
- Improve availability/uptime
- Identify bottlenecks using OEE
- Add inspection equipment
- Add robotic cartoning/palletizing.
With this new equipment comes a challenge. As one corporate manager notes, training machine operators on new equipment and working on their performance output are crucial to getting product out the door. One engineer notes that with the lack of labor, many processors are being forced to automate where they can. Another major issue is hiring and keeping qualified maintenance personnel, says one manager. Compound all of these issues with the retirement of skilled technicians and workers, and keeping the ranks filled with qualified people is not an easy task.
Solving some of these labor issues may require a rethink—for example, one engineer calls for “servant leadership and putting our workforce first increases their value.” (See “Finding operational success via employee engagement,” FE, August 2016.) An operations manager calls for a culture change with staff on the production floor for more accountability. Another engineer notes there isn’t enough focus on employee safety at his facility, but this also extends to equipment vendors, who should be held accountable for the safe design of equipment and thorough operating instructions so operators are not at risk running potentially dangerous machines.
Most processors are using one or more continuous improvement systems. This year, the most commonly used continuous improvement systems among respondents include total quality management (TQM) systems (41 percent), lean manufacturing (40 percent) and self-directed work teams (34 percent). Other popularly reported systems in use include total productive maintenance (TPM), Six Sigma and following recommendations from third-party audits.
Food safety and social programs
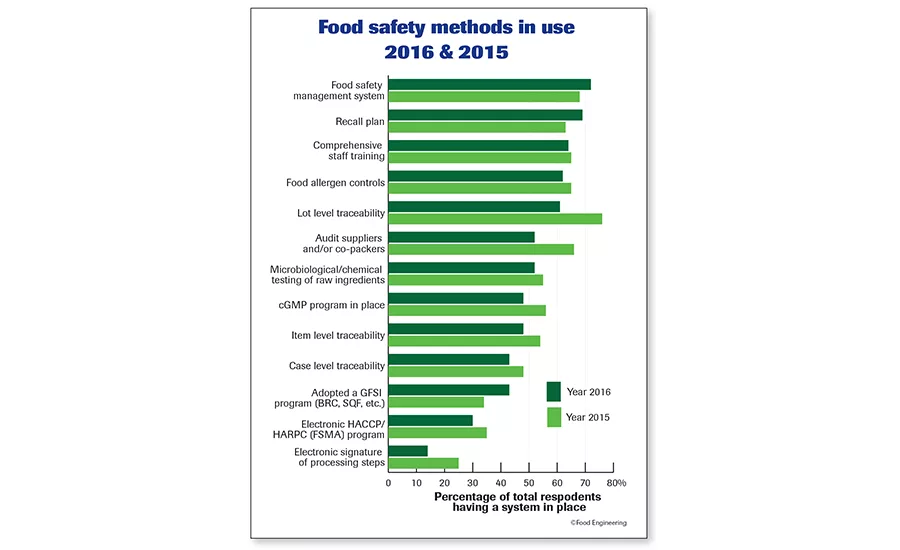
The good news is that more than two-thirds of survey respondents report using a food safety management system (72 percent) and/or having a recall plan in place (69 percent). Though some numbers have gone down slightly—probably due to margin of error—lot-level traceability has shown a 15 percent decline compared to last year, perhaps due to other systems that have the ability to do this task. Item- and case-level traceability are also reported having slightly less use than last year (see graph). Also a surprising number, only 14 percent of respondents report having electronic signatures of processing steps in place compared to last year’s number of 25 percent.
This year, two-thirds (67 percent) of respondents (last year, the number was 72 percent) say they currently have a social responsibility or sustainability program in place, with the majority having workplace programs, social responsibility/community outreach and/or systems to monitor water and electricity use per unit of production. In fact, 61 percent of those reporting having a sustainability program in place designate water and electricity monitoring—this figure is up from just 46 percent recorded last year. In addition, monitoring greenhouse gas and/or carbon footprint is being practiced by 40 percent of those who say they have sustainability programs in place, compared to 27 percent last year.
Additionally, half of the processors responding to our survey have improved their training programs in the past year, while 34 percent have initiated plant floor continuous improvement programs. Thirty percent have self-directed work teams, and 28 percent report their work teams also learn maintenance skills.
Who participated in this year’s survey?
Information in this report is drawn from the June 2016 survey of Food Engineering readers. This year’s makeup of respondents includes 33 percent from corporate management and administration; 23 percent, engineering; 21 percent, plant operations/production; 15 percent, QA/QC; 4 percent, research and development/product development; 1 percent purchasing; and 3 percent from other categories.
Baking and snack food products; processed meat, poultry and seafood products; and dairy and frozen novelty products each account for 15 percent (45 percent total) of the total number of respondents. Other food and beverage categories represented include beverage products, 13 percent; shelf-stable foods, 7 percent; cereal and grain-based products, 7 percent; flavors, ingredients and supplement suppliers, 7 percent; candy and confectionery products, 6 percent; corporate headquarters and R&D/pilot plants, 4 percent; frozen food and prepared meats, 4 percent; and other categories, 7 percent.
►Read more: Annual State of Food Manufacturing Survey ranks automation top trend
Looking for a reprint of this article?
From high-res PDFs to custom plaques, order your copy today!


