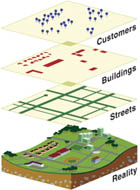
A map of foodborne disease

The underlying data on roadways, daytime and nighttime census numbers, health-service providers and other information for 137 US cities reside in an eight terabyte (8,000 gigabytes) database.
Three years ago, food scientists at the University of Tennessee in Knoxville secured $599,000 in USDA funding to launch a seminal GIS-based food safety project. Working jointly with researchers from the Oak Ridge National Laboratory (ORNL) in nearby Oak Ridge, TN, the scientists are mapping the transmission, survival and movement of pathogenic bacteria through the environment and potentially into the food supply. The epidemiological assessment of foodborne disease began with farm-level sampling to determine the occurrence and migration of specific bacteria. The resulting data are being layered with data about weather conditions, topographical information, farm practices and other information to create a visual representation. The objective is to create a model that can be applied to future disease outbreaks and map how a bacterium moved from farm livestock to the processing plant and, finally, the human digestive track.
Collaborators in the pathogen risk assessment project include Anthony Q. Armstrong, an expert in toxicology and environmental risk at ORNL, and F. Ann Draughon, professor of food microbiology and toxicology at the University of Tennessee. Draughon also is co-director of the school's Food Safety Center of Excellence and the originator of the GIS project.
Draughon: We have very good information now about the incidence of disease outbreaks but not much to trace them back to their source. How did a foodborne pathogen get to the patient in the first place? Food safety data are extensive, and the strength of GIS is in handling huge amounts of data.
FE: What advantages does GIS provide?
Draughon: For the most part, we're still looking at 1-D pie charts and graphs, which are not optimal presentation formats. We're conducting a systems-based risk analysis to evaluate the impact of farm management practices on factors such as contamination, proliferation, transmission and survivability of pathogens. For example, there are more than 2,500 types of Salmonella. If you were to trace those pathogens from the farm all the way to an outbreak of the disease in the human population, the data would quickly become far too complex for conventional presentation formats. When we started looking at GIS, we realized it would be an excellent tool to overlay a great deal of information in an understandable format. I knew ORNL had 25 years experience with GIS. ORNL experts know how to pull data off GIS websites and build the necessary models. They were full partners in our original grant proposal to USDA three years ago.
FE: Describe the project's scope.
Draughon: The goal is to develop population-based epidemiological information for major foodborne pathogens at the farm level to develop risk-management strategies based on temporal, spatial and environmental factors, including projection and management practices. Four pathogens and two protozoans-including E. coli 0157:H7, Campylobacter, Salmonella, and Listeria-in cattle, hogs, poultry and dairy operations in California, Tennessee, Alabama and Washington state are being tracked to develop epidemiological algorithms to build a spatial model using GIS to identify risk factors for contamination of humans and animals.
FE: How did you go about building your database?
Draughon: Samples were collected from 16 sites at three-month intervals over an 18-month period. Participating farmers used test kits to collect fecal samples, feed samples, rectal swabs from livestock and soil samples-about 1,800 soil samples alone. It's not a tremendous number, but with risk assessment, we're able to say, "This is the most likely spatial relationship in how these pathogens move between various points."
FE: What are some of the preliminary findings?
Draughon: Oak Ridge is still generating the risk-assessment model, looking at the relationships between air, soil, available water, feed, agricultural management practices, animal receptors, exposure to pathogens and release of them back into the environment, then putting everything into a conceptual model to start quantifying statistical risk. What has been done is a massive job of isolation of specific pathogens from farms across the country and genetic characterization of those isolates.
DNA fingerprinting was completed to trace each bacterium's path between the various sites. We found very similar or identical fingerprints of E. coli 0157:H7 in dairy cows in California, Tennessee and Washington, but when we found it in swine, it was a very different genomic subtype. The incidence also was much higher in swine than in beef, which was a pretty shocking finding. The fact that we have so many swine in so many geographic locations with the same isolate tells me we probably have E. coli in the feed supply. We also found the same pathogen in the rectum and the bedding of chicken and turkey isolates; on the other hand, we did not find it in soil samples, so I don't think soil is an important vector.
There are almost a million E. coli serovars, and one is 0157:H7. Within the serovar are molecular subtypes. We tracked 120 isolates with about 30 molecular subtypes. That data alone would be much too complex to present in pie charts. When you start layering on seasonal data and other information, GIS becomes the only manageable presentation format.
FE: How complex will this GIS application be?
Draughon: The database will be in the tens of gigabytes in size, with close to 100 layers of data. We'll include everything in the farm environment that can contribute to pathogen cultures and their transmission, environmental factors such as weather data from the National Oceanic & Atmospheric Administration and the census bureau's TIGER (Topographically Integrated Geographic Encoding and Referencing) database. A Microsoft database has been developed, and the modeling program will make it easy for researchers to conduct analyses with a Windows-based operating system.
FE: Are there applications for GIS in food recall scenarios?
Draughon: Absolutely. GIS is great for creating scenarios and table top exercises that estimate the spread of animal or human diseases based on existing data, such as feedlots, points of sale, transportation routes and retail outlets. The goal is early diagnosis to avoid a catastrophic situation in which millions of animals must be destroyed, and GIS is great for that.
The key point is that the amount of sales data, animal transfer records and other data is so enormous that quick analysis is impossible using conventional methodology. A lot of people have a hard time interpreting graphs and understanding what is being presented. GIS is a visual system; it's a sophisticated tool to develop, but the resulting maps are not difficult to interpret and can be used by people at every level.
FE: What are some potential applications of GIS for food processors?
Draughon: The source of pathogenic contamination is both a sensitive issue and a liability concern. There is a lot of litigation concerning Salmonella in water from wells near packinghouses and other processing facilities, and it's easy to blame food plants when problems occur. But when you look closely, other factors often are identified as the source, such as poor farming practices and improperly sealed wells. We demonstrated the application of GIS in a study in Knoxville, where a poultry farm at a bend in the Tennessee River near our campus was assumed to be the source of Salmonella. Using FDA BAM (Bacteriological Analytical Manual) methods, we analyzed air, soil, water, animal, insect and feed samples and concluded more likely sources included a hospital, a waste treatment plant up stream and birds. A map can simplify the presentation of the data.
We need to know the facts, not just make assumptions, and GIS is a valuable tool to create models to depict the interaction of various factors.
Looking for a reprint of this article?
From high-res PDFs to custom plaques, order your copy today!