The State of Food Manufacturing in 2023
August 11, 2023
The State of Food Manufacturing in 2023
August 11, 2023
FOOD ENGINEERING annually contracts with B2B market research firm Clear Seas Research to survey members of the food and beverage industry with the goal of seeing how the current year is going for them. We then compare those results with those of past years to identify trends. The great part about the State of Food Manufacturing survey is that it provides us insight as we delve into our annual Top 100 Food & Beverage Companies, which we’ll release next month. As you’ll see, much of what this year’s study found is corroborated in our Top 100 regarding what has and what is affecting business in 2022-2023. We’ll delve into some highlights of the survey results here, and you can visit www.ClearSeasResearch.com to download the full survey.
Production is Solid
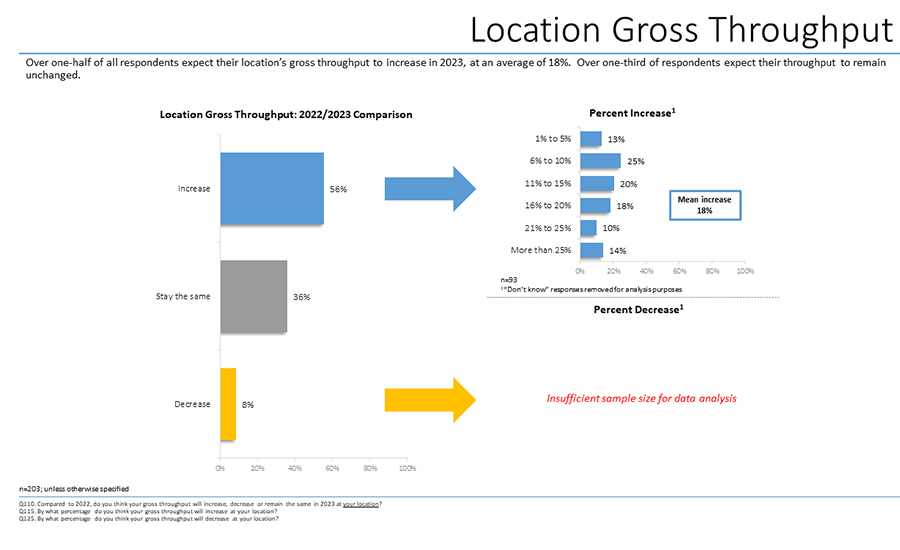
The study found that a lot regarding production in terms of volume is good. Approximately 56% of respondents said there was an increase in throughput in the past year, while 36% said throughput was about the same. Compare that to the 8% who said they saw a decrease; overall, the vast majority of those surveyed indicate that business is doing well. Among those saying there was an increase, the mean was at a healthy 18%. In fact, 14% said their business saw more than a 25% increase in throughput.
Why were so many saying that they were expecting an increase in throughput? Increased sales, increased business and new customers. Oh, and demand. Together, those factors accounted for 60% of the expected increase in throughput, ahead of other reasons, such as new products (12%), updated equipment (7%), expanded locations (6%), efficiency (6%) and others.
The opposite was true for those expecting a decline. They cited decreased sales and demand, as well as the economy and inflation, as the reasons for their response.
Profit? Not So Much
The economic “law” of supply and demand can sometimes be a double-edged sword. It’d be a reasonable conclusion that with 56% of respondents saying throughput increased because of demand or new sales that revenue would also increase. After all, the law of supply and demand states that as demand rises, prices also rise. As prices rise, so does revenue…unless the prices of materials and ingredients also rise because of supply and demand. Oh, and inflation.
Eighty percent of respondents to the survey said that material cost per product increased. Eighty. Percent. If COVID has shown us anything, it’s that small- and medium-sized companies, especially those not vertically integrated, tend to get hurt the most with increased material costs due to their limited supply chain options. (This was backed up by the results of our Top 100 research, which you’ll see next month.) More than half, 59%, said the increase in material costs was between 1%-10%, and the rest said they saw a higher increase. Nine percent said the increase was more than 25%.
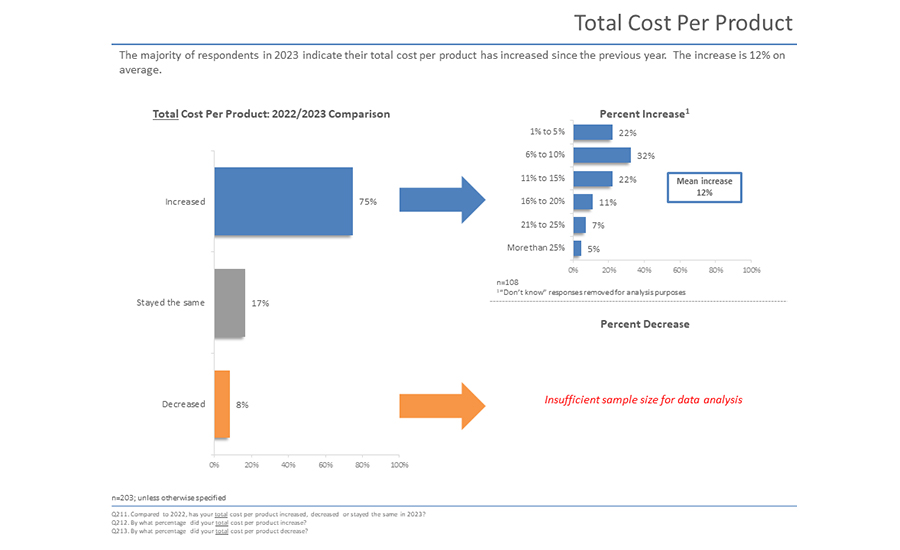
This all led to 75% of respondents reporting that the total cost per product increased. On average, the increase was 12%
Increasing throughput to keep up with demand isn’t as easy as flipping a switch. Okay, maybe in some very limited cases it is as easy as flipping a switch (or pressing a few buttons), but it usually means spending money, either on equipment, facilities or people.
Looking for a reprint of this article?
From high-res PDFs to custom plaques, order your copy today!
Overall, 36% of respondents said that the size of their workforce increased in 2022-2023, and 77% said that increase was because of growth. Conversely, 19% said that their workforce has decreased, with the top reasons cited as being unable to find qualified replacements as people leave, budget cuts or a decrease in output.
However, nearly half (48%) of our respondents said that their current locations are understaffed. Most (71%) are compensating for that increase in throughput while understaffed with overtime. Others may also be adding overtime, but they’re taking steps to change shifts or production schedules, too.
Most said that their companies have increased wages to hire new workers or retain current ones. Other companies have begun to offer more training, followed by others investing in retention and improving things like health benefits and vacation time. About 21% of the people who responded said that their companies have taken all of these measures to hire and retain qualified employees.
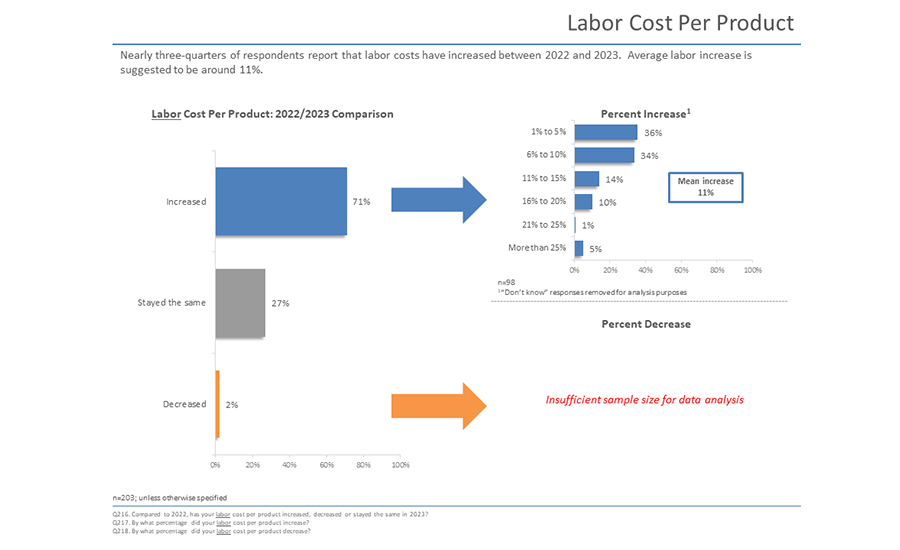
Such an emphasis on hiring people, and what it takes to retain them, led to an increase in labor cost per product by 11%. This increase was reported by 71% of survey respondents.
Improving Productivity
Increased material and labor issues have combined to put a dent in profits despite strong demand. However, our survey respondents have shared that they see ways for their companies to improve productivity and increase profitability. Unfortunately, the old adage “you have to spend money to make money” would seem to be the best option to achieve that.
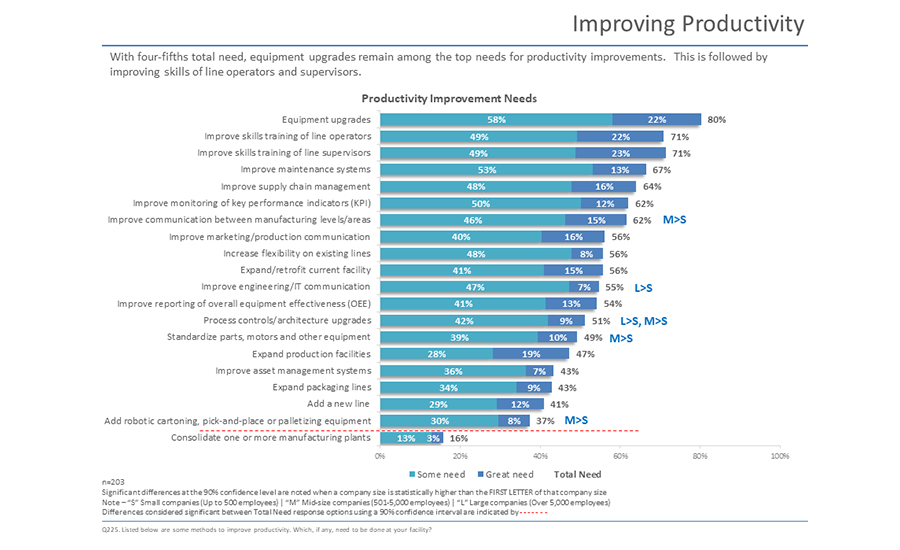
The 2023 State of Manufacturing Survey provided a list of methods that can be used to improve productivity and asked the respondents to tick which ones, if any, their companies needed to do. (Since they could mark more than one, the tallies would go past 100%.)
Making equipment upgrades topped the list with 80% who said their facility was either in some need or in great need. Improving the skills training of line operators tied with improving the skills training of supervisors by being chosen by 71% of the survey takers. From there, the choices trended downward relatively consistently until it came to consolidating one or more manufacturing plants. That option was chosen only 16% of the time.
In a question about improving operations, training operators and involving them in maintenance and improvements was the top strategy chosen, followed by improving throughput, and then changing out or upgrading equipment.
The respondents’ budgets for changing out or upgrading equipment show that despite the reduced revenue, there’s optimism that’s going to change for the better. Nearly 50% of respondents said they expect their budgets to increase for production, packaging and processing equipment. That increase is expected to be by 23%, on average. Approximately 28% of respondents expect their budgets to increase by more than 25%.
Interestingly, a trend pointed out in FE’s 2022 State of Food Manufacturing webinar looks like it’s continuing into 2023, which concerns automation. Specifically, budgets for automation aren’t increasing overall.
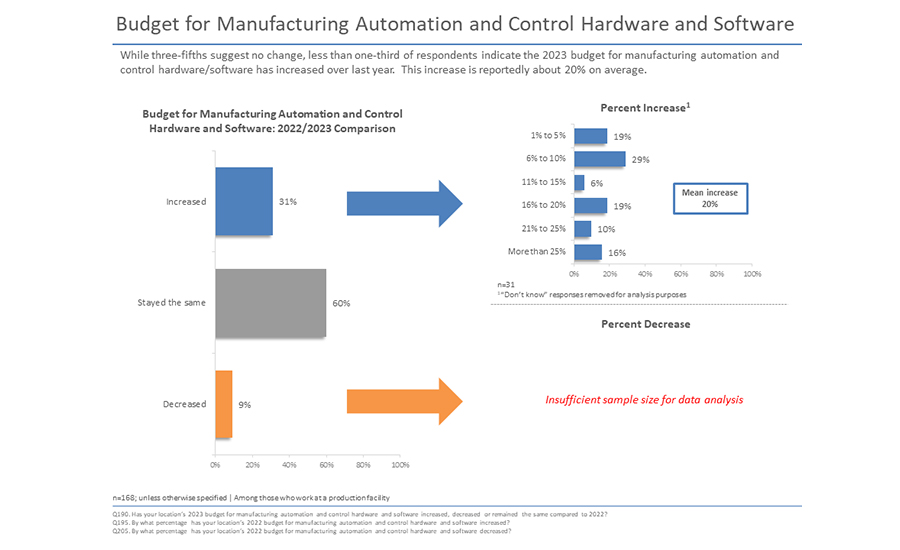
While 31% of respondents said that their budgets for automation and control hardware and software are increasing, 60% said their budgets for that are staying the same, while 9% said their budgets are actually decreasing. This is interesting given the labor issues mentioned earlier.
One would assume that investing in automation would help manufacturers produce the same or more products with less staff. FE has produced a lot of content regarding automation, specifically that it’s not intended to replace individuals but to help them be more productive. Given the loss of staff suffered by many food and beverage manufacturers, it would only seem logical to invest available funds into helping existing staff produce more. Instead, it would seem that those funds are being used to attract and retain people.
None of that is to say hiring people is bad or hiring people is a bad strategy—we all want people to have jobs that pay them well enough to live happy, comfortable lives. But it doesn’t answer the question of why manufacturers are eschewing automation for people. Is it a cost issue? Is it a matter of machines still being able to perform certain tasks? We didn’t anticipate this result, so we didn’t ask the question. That said, we’d appreciate any insight our audience might have to offer on this matter.
To get the full survey for yourself, visit www.ClearSeasResearch.com.