FOOD ENGINEERING’s 45th annual plant construction survey
Supply chain issues continue to impact project planning and construction.
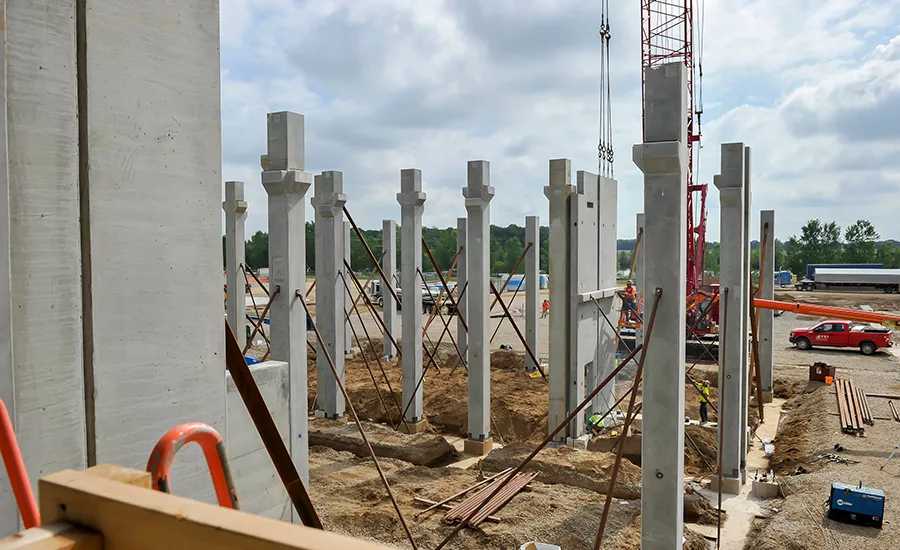
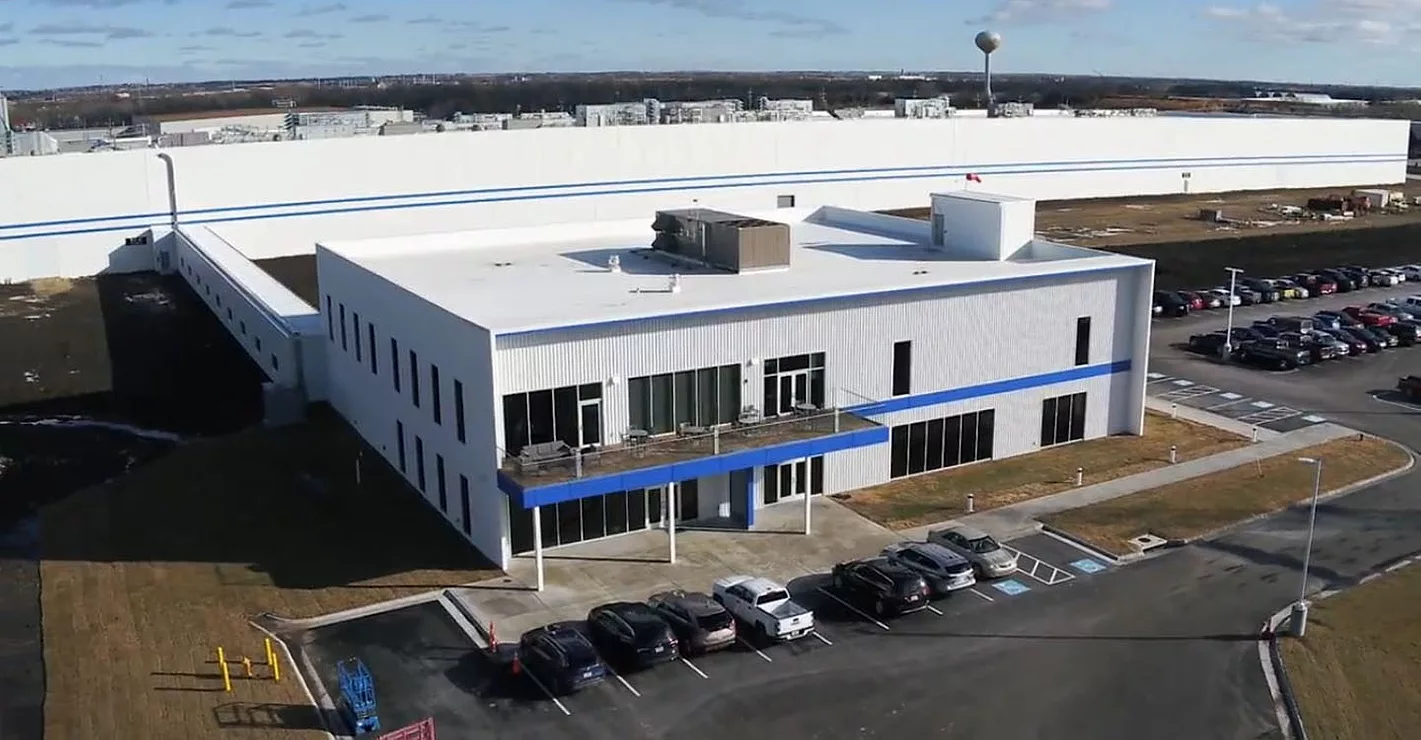
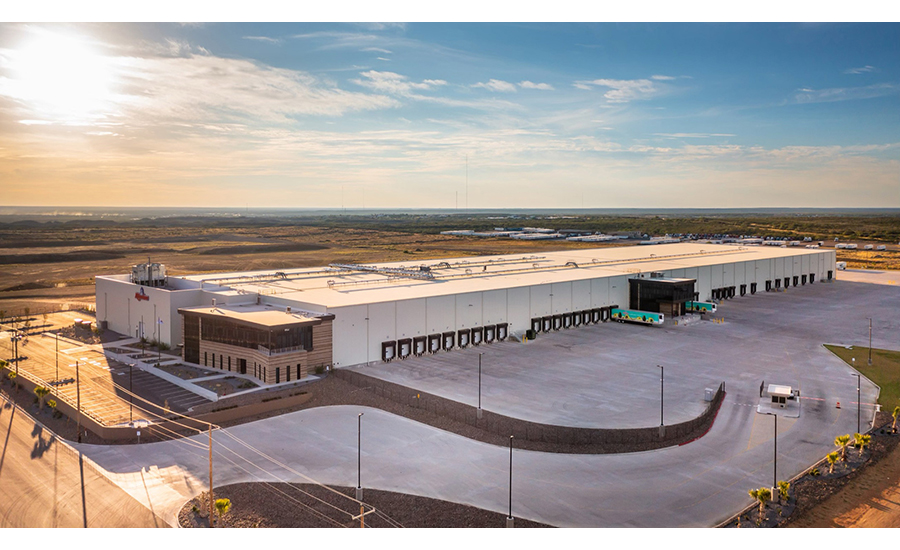
Photo courtesy of Shambaugh & Son.
2021 projects edge out 2020 projects
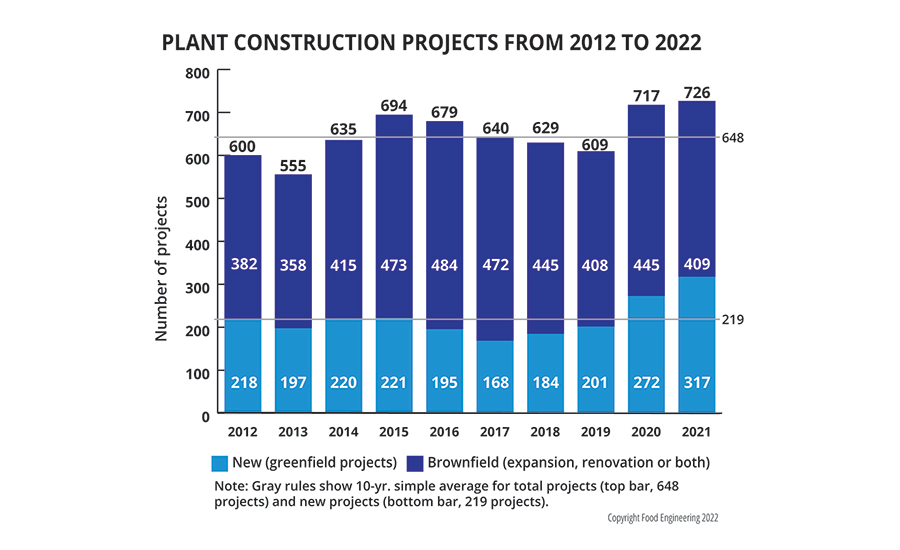
In looking at FE’s 45th Annual Plant Construction Survey project table, reportable food projects for 2021 edged out 2020 projects by 1.3% or for an increase from 717 projects recorded in 2020 to a total of 726 projects in 2021. This total includes new projects, renovations and expansions, warehouse/distribution centers (DCs), pet food, alcoholic beverage and cannabis facilities. It also includes the construction of water/wastewater treatment centers as these projects can be valued at a large percentage of what a food plant costs to construct—and often a food plant can’t function without them. A renovation counts as a new project when it is the processor’s first facility at a new location, and an existing non-food structure has been gutted and repurposed as a food, beverage manufacturing or DC/warehouse facility.
Reportable food and beverage-related projects are those valued at over $1 million and commenced in the U.S., Mexico or Canada. They have been made public by the processor, a government entity (including local or state economic development groups) or the A&E/C firms responsible for them.
The survey includes projects begun, announced by any entity or completed in 2021. If dates listed are beyond 2021, they reflect the expected completion date for a project either announced—or under way—in 2021. Projects that appeared in last year’s table with a 2021 (or later) date were carried over—unless there was an obvious duplicate. Keep in mind, some projects can be announced, and then dropped at the last minute for any number of reasons, e.g., legal problems, lack of expected funding, site issues, changing needs, etc. In the table, “D/W” refers to distribution/warehouse, and “DC” refers to distribution center; “Exp.” refers to expansion and “Ren.” is for renovation.
The table includes—besides facilities specifically related to human food—pet food, cannabis (CBD), nutraceutical products and ingredients such as flavors, yeast-based products and alternate proteins, including cultured protein products.
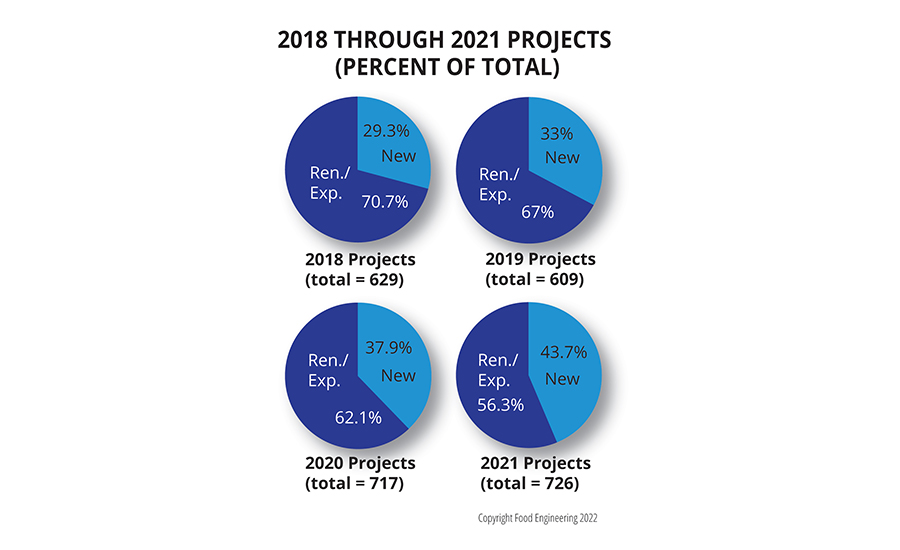
An interesting trend has developed over the last four years with 2021 showing the highest percentage of new projects compared the total number of projects altogether.
New projects versus expansions
In 2021, new projects accounted for 43.7% of total projects or 317 out of 726 total projects. The percentage of new projects was 16.5% higher than last year’s number, which totaled 272 out of 717. Consequently, the 2021 number of expansions/renovations totaled 409 out of 726 or 56.3%. This percentage fell by 8.1% from 2020’s number of 445 projects out of 717. The 2021 number of all projects (726) was 12% higher than the10-year (2012-2021) average of 648.4 projects. In addition, 2021’s number of new projects was 44.6% higher than the ten-year average of 219.3 projects per year.
Most interesting is the ratio of expansion and renovation projects to new facilities, which has steadily fallen since 2017, indicating that new projects have been on the increase. This trend may be a reflection that some existing structures neither support automation very well nor have sufficient room to grow. In some cases, processors have turned these facilities into warehouse space and located a new processing plant where there is ample space, the economic environment is more suitable or the availability of labor is better.
Speaking of warehouses and DCs, 2021’s number of projects was only 2.1% lower than 2020’s facilities—that is, 137 projects versus 140 in 2020. In 2020, the number of DC/warehouse projects was 19.5% of total projects, and in 2021, DC/warehouse projects accounted for 18.9% of total projects. However, 2021’s number of warehouses and DCs was 63.5% above the simple ten-year average of 83.8 projects.
Alcoholic beverage projects for 2021 numbered 52, up slightly from 50 projects recorded in 2020, and down 11.4% from the ten-year average of 58.7. Alcoholic beverage projects (production or DC), accounted for 7.2% of 2021 projects.
While we haven’t kept track of pet food projects at any great length over recent years, it is notable that pet food projects in 2021 nearly doubled over 2020’s number, that is, from 23 recorded in 2020 to 45 in 2021. In 2021 pet food projects accounted for 6.2% of total projects. In addition, while it’s difficult to obtain statistics for cannabis/CBD projects (many are proprietary), we found 9 in 2021 compared to 13 in 2020.
End of Part 2
Looking for a reprint of this article?
From high-res PDFs to custom plaques, order your copy today!