TECH FLASH
Give SPC a role in your plant
While SPC isn’t a panacea for all process ills, it can help you fine-tune your process to assure greater product consistency.
Statistical process control (SPC) is not a new technology—its methods were pioneered by Bell Labs in the 1920s, and the technology was first applied in the war efforts of the ‘30s and ‘40s to boost munitions production. The problem was that without easy computer access to automate the calculations, SPC was not easily applied to most industrial processes, especially real-time processes such as those found in the food and beverage industry.
Today, with PC-based SPC software available from many sources and an arsenal of sensors to measure just about any process parameter, SPC can be applied to processes to peak their efficiency, control product quality and monitor and control the parameters that affect food safety. John Clemons, director of manufacturing IT for MAVERICK Technologies LLC, has authored a white paper, Putting SPC to Work in Manufacturing: Reducing Variability and Increasing Productivity. MAVERICK, a system integrator, recently partnered with Northwest Analytics (NWA) to provide integration of NWA’s SPC software with process control systems.
|
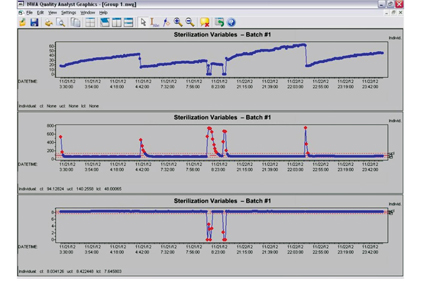
| In the chart above, an aseptic process was used to sterilize the product and containers and then seal the containers. SPC was applied, and real-time warnings were triggered when underlying variables such as pressure, temperature, speed or flow started to trend in the wrong directions. Source: MAVERICK Technologies |
“SPC can be used to help prevent and correct process variables,” says Clemons. Typically, the data used by SPC resides in a database and/or historian. To make SPC work, two different types of data are required: process data from sensors in the process (e.g., temperature, moisture content, pressure, flow, etc.) and descriptive data that describes the batch and provides the process data context. This data includes, for example, batch number, product, material, manufacturing order, supplier, recipe, etc.
Providing the operators on the plant floor with real-time statistical charts of the process allows them to see what’s going on in the process. They can effectively diagnose problems and discover what’s causing the process to stray from its expected parameters. For example, if a process has been yielding product containing bacteria at certain times or shifts, an SPC chart could reveal why the kill step in the process isn’t consistently working by showing an out-of-bounds sterilization temperature or length of time held at a certain temperature for a given mass and/or flow volume.
For operators to react to out-of-bounds specifications, processors must first set application limits. In fact, many processes with HACCP rules do have limits set. The problem, according to Clemons, is that many manufacturers set their out-of-spec limits too broadly. Thus, while products may appear to be within the range of set limits, there still may be a significant degree of variability, which can not only affect product safety, but quality as well.
It’s the SPC control chart that shows where things go awry. SPC doesn’t use the specification limits for a process, but mathematically analyzes the process data to determine upper and lower control limits, according to Clemons. These limits are usually much tighter than the specification limits, but as the process stabilizes, the specification limits can be fine-tuned to match the control limits.
Working together with the control chart, pattern rules establish data-based rules that determine which adjustments should be made to the process to keep it within control limits. These rules work well when a controlled process is trending close to the center line. For example, a pattern rule might say to make a small downward adjustment when three or more successive data points are above the center line. When pattern rules are used, warning limits are often added to the SPC control chart as well.
In an application shown in the chart above, an aseptic process was used to sterilize the product and containers and then seal the containers. Because the process is very sensitive, when sterilization was lost, it could take up to an hour to clean everything out and regain sterilization. SPC was applied, and real-time warnings were triggered when underlying variables such as pressure, temperature, speed or flow started to trend in the wrong directions. In this way, operators could take corrective action before losing sterilization. This method cut downtime from sterilization losses by 50 percent, which increased total throughput by about 20 percent.
The white paper also looks at real-time SPC, historical SPC, assessing improvement and SPC’s relationship to continuous improvement programs like Six Sigma or lean manufacturing.
For more information, download the white paper or contact:
John Clemons, MAVERICK Technologies, 205-807-2119, john.clemons@mavtechglobal.com
Dana Petrusich, Northwest Analytics, 503-224-7727, ext. 104, dpetrusich@nwasoft.com
Looking for a reprint of this article?
From high-res PDFs to custom plaques, order your copy today!