Visual Acuity
With processors collecting more data than ever before, how they manage it is the key to its usefulness
Automation, artificial intelligence and data collection have made the visualization of production a reality in food and beverage processing plants. When data is managed and presented properly, operators, production managers and executives can look at any given dashboard and see a real-time visual representation of the process.
Typically, screens display information that is germane to their locations. For instance, machines that detect chemical composition display contamination data, while another screen by the mixers shows mixing parameters, and yet another by the oven reveals oven data, etc. In addition to each screen and dashboard on the plant floor, the latest data systems have a cloud-based interface that allows the information to be accessed on iPads and other devices for instantaneous production data viewing.
All of these tools are a far cry from Excel sheets and employees walking around with pencils and clipboards. They turn data collection into a routine task instead of a time-consuming chore. But because there is so much data that can be collected, it is important for processors to be able to turn that data into useful information.
There are a number of different aspects of production where better data collection and management pays off, and there are almost no limits to what processors can do with their data once they have a way to use it instead of just compiling it.
Visualization in action
Bakery on Main was founded in 2003 with a philosophy to create healthy food that tastes great, too. Based in East Hartford, Conn., Bakery on Main makes and sells celiac-safe cereals, oatmeal, granola bars and snacks. The company has more than 100 employees and has grown quickly. Until early 2020, however, their quality data was captured on paper—and responding to production issues was challenging.
“It was only at the end of each day— when my assistant manager or I reviewed paperwork—that we would spot out-of-control processes,” says Jegadish Gunasagaran, quality assurance manager at Bakery on Main.
In an effort to prevent production issues that might drive down revenue, Bakery on Main started researching cloud-based, digital quality solutions so they could view data in real time, and stop production issues in their tracks. The bakery chose Enact, a cloud-based quality management solution from InfinityQS.
“The thing we liked about Enact—from Day 1—is that the interface is simple. You go to your dashboard, you see what your tests are, and you can instantly view your results,” Gunasagaran says.
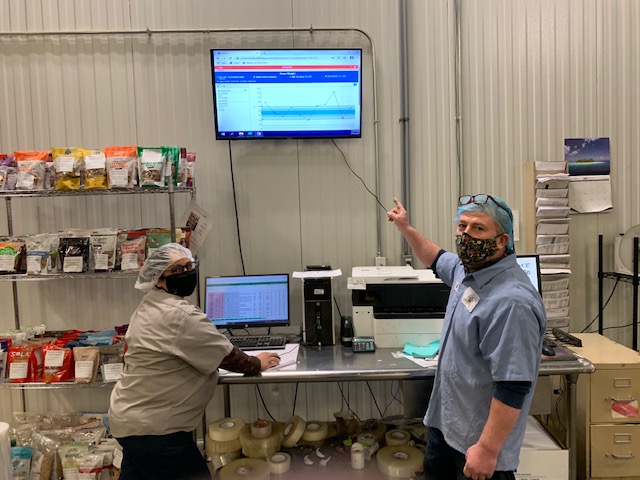
Beginning with a Proof of Concept digitizing data collection on a single process in early 2020, Bakery on Main has since scaled up its deployment of Enact across all lines and processes in its East Hartford plant. Now, large TV screens installed throughout the site display Enact dashboards, providing Bakery on Main’s operators, production managers and quality executives immediate visibility into how processes are performing and trending. If a process deviates from specifications, Enact automatically sends alerts to team members to take corrective action before an issue escalates.
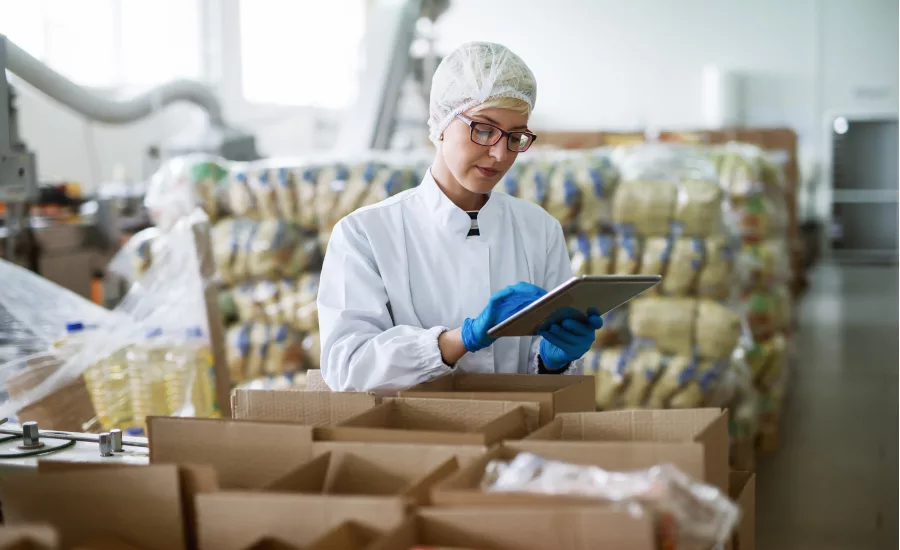
Enact’s user-friendly interface and data visualizations allowed the cloud-based solution to be easily adopted by plant personnel. Photo courtesy of Bakery on Main
Gunasagaran credits Enact’s user-friendly interface and data visualizations for how easily the cloud-based solution was adopted by plant personnel. “Before, it was only at the end of each day—when my assistant manager or I reviewed paperwork—that we were able to analyze process deviations. We recognized that we needed to see what was happening, as it was happening, so we could focus our attention. Now, using Enact, anyone in the plant can look at the TV screens, see if a process is starting to get out of control and fix it immediately. I now have more time in my day to focus on important things, such as process optimization and improvement.”
Steve Wise, vice president, digital food safety at InfinityQS, says, “What Bakery on Main has accomplished illustrates the transformative impact of cloud-based quality intelligence within food manufacturing. The cloud empowers plant personnel with real-time data and insights into process performance so they can take immediate action to stop costly quality and safety issues before they get out of hand. Enact switches operators and quality teams from a reactive mindset of worrying about catching issues, to proactively preventing problems from occurring in the first place. For a brand like Bakery on Main, who prioritizes product integrity and consumer health and safety, Enact’s high level of data-driven quality assurance is invaluable—and is only possible by moving away from paper-based systems.”
Safety and quality
If a processor needed a way to detect chemical composition and contaminants in their meat products for food safety and food quality, they might use a hyperspectral imaging system, like one from P&P Optica (PPO).
PPO developed its Smart Imaging System in 2015 specifically for food processing, and it operates on the line in real-time. “By combining hyperspectral imaging with advanced artificial intelligence and machine learning, PPO provides processors with the ability to consistently identify the most common and hard-to-find contaminants at line speed, and to gather real-time insights about their products,” says Olga Pawluczyk, CEO at PPO.
P&P Optica’s Smart Imaging System allows processors to address multiple problems at once: assessing product quality and composition, finding foreign objects, and automating/optimizing production. Photo courtesy of P&P Optica
The system uses hyperspectral imaging to detect chemical composition and foreign materials in food—primarily in meat products. It also gathers real-time information on food quality, including protein, fat content, water content and flavor, as well as product quality issues such as woody breast in chicken.
Pawluczyk explains that PPO’s system uses light to predict chemistry, which allows the machine to detect differences in the material being inspected and, as a result, it can recognize a range of contaminants that can’t be found by other solutions—materials like plastics, rubber, cardboard and bone.
“With a single piece of equipment, PPO’s Smart Imaging System allows processors to address multiple problems at once: assessing product quality and composition, finding foreign objects and automating/optimizing production,” she says.
Hyperspectral systems gather significant amounts of chemistry data, or the “chemical signatures” of the products they are assessing.
“If PPO’s system finds a foreign material on the line, it is able to compare the chemical signature of that contaminant with a database of known materials, and can provide specific information about the contaminant. This shortens the investigation process and makes it much easier for companies to find and resolve the cause of the contamination,” Pawluczyk says. The system can also identify and remove product flaws such as poor meat quality and recipe formulation errors.
“The system uses artificial intelligence and machine learning to identify trends and provide a holistic picture of what is happening in the plant over time. This insight helps processors understand how to prevent future contamination or product quality issues. For example, they might identify issues with a particular supplier or the need for additional staff training,” she says. “An analysis of trends spotted by the system can flag specific process challenges on a given production line (or shift), or equipment in the plant that is causing ongoing contamination problems. Factors such as quality of feed or packaging could also be investigated, by assessing their impact on the composition of product as it’s inspected at the processing facility.”
The hardware is designed to integrate into existing production lines, and immediately automates safety and inspection quality tasks. “The biggest challenge we’ve found is that some plants don’t yet have the processes and procedures in place to manage all the new data that’s available to them through PPO’s system,” Pawluczyk says. “Our PPO Insights software provides an easy-to-use visualization tool that helps surface the most important or impactful actions they can take, based on the chemical data we collect.”
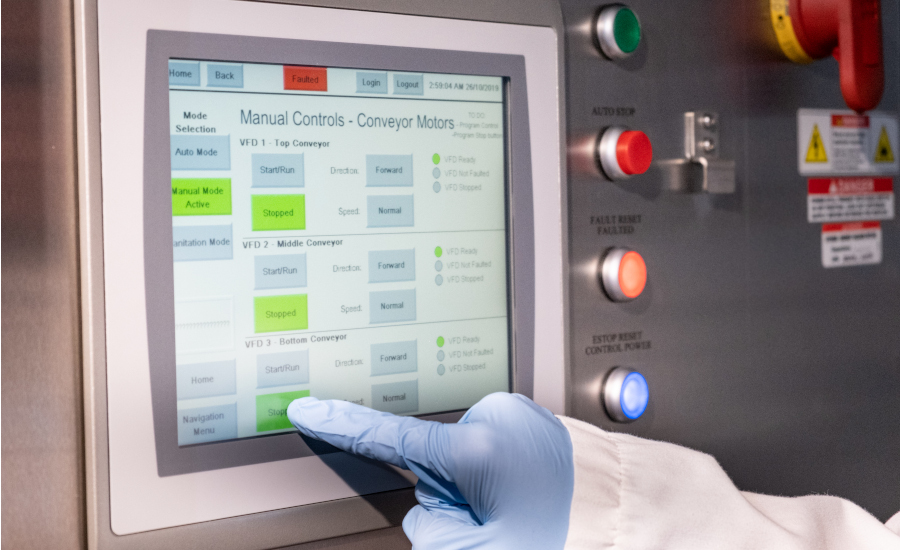
Under pressure
The need for data management in the visualization of production is not limited to any one type of processing. Look at high pressure processing (HPP) as an example. According to JBTAvure’s director of global customer care, Tim Boyle, iOPS is JBT’s IoT answer for their HPP equipment. “With iOPS, we can harvest data generated during operation of the HPP machines and send it to the cloud,” he says. Once it is in the cloud, JBT can use analytics to develop reports for their customers to help them improve upon their overall equipment effectiveness (OEE).
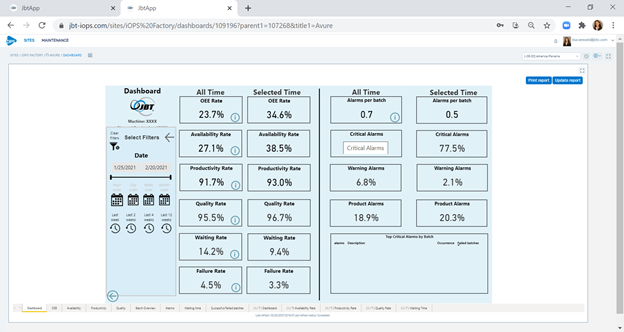
JBTAvure’s IOPS cloud-based system allows customer management personnel to access machine and operation data from anywhere via the internet. Photos courtesy of JBTAvure
JBT has been in development of this technology for the last couple of years, and it is part of the overall JBT family of products. For customers, the data that is collected can be used to generate reports that help improve their operations. “By looking for areas of waste in terms of process time, customers can fine tune their operations to increase overall throughput. More throughput means more revenue generation,” Boyle explains.
“One of the great features of this product is that since it is a cloud-based system, customer management personnel can access machine and operation data from anywhere via the internet. Working with some of the customers using iOPS today, we were able to show them that their upstream process was starving the machine at different times of the day. They were able to look at this and stagger shifts between the production and HPP areas to ensure more consistent flow of material to the HPP machine,” he says.
JBTAvure approached HydroFresh, a Midwestern HPP toller, to be a beta site and implement iOPS into their suite of services. HydroFresh has been operating iOPS for roughly seven months, and the toller’s vice president, Mike Billig, says that one of the first projects they implemented was to project real-time data to their team members via television monitors located in the production area along with the operational standards needed for success.
“Our team members know immediately if they are not meeting the throughout standards and can adapt quickly to rectify the situation. We have been able to improve our overall line efficiency by 10 percent… We identified the initial areas for improvement and have used iOPS data to guide us to improvement,” Billig says. “Once improvement is made in these areas, we will move onto the next set of operational data and implement the new standards to ensure continued success.”
Billig notes that the biggest challenge has been sorting through the large amount of data and identifying the areas where it would be most beneficial to our operation. “iOPS has the ability to identify areas for improvement and we had to determine the key elements that would have the most positive effect in managing how we run our line,” he says.
Boyle says that from a supplier’s perspective, the biggest challenge is getting the smaller operations to see the value of collecting data and analyzing it. “With the continued growth of HPP in the food processing industry, we have a variety of both small businesses and large corporations running HPP. For the smaller operations, getting them to believe in the value of data and analysis to improve their business is a challenge. They are entrepreneurial groups that are building up their levels of sophistication. We need to help show them the value of data to help drive their business gains,” Boyle says.
Emerging technology
PPO’s Pawluczyk says they are excited about the possibilities for the new wealth of data made available with AI. “We see it having an impact all along the food supply chain—from farm to fork. By gathering this rich chemistry information, PPO can work with our clients to start optimizing farming practices. For example, processors that use PPO’s system to detect woody breast can correlate issues in the plant to activities on the farm (such as feeding practices). This can lead to changes in how chickens are fed and grown, to increase quality or flavor or reduce instances of woody breast,” she says.
JBTAvure’s Boyle says, “For us we see the data growth leading to more ways we can help customers with predictive maintenance in the future. By monitoring and developing baselines related to maintenance downtime, we can look for data trends to help identify upcoming maintenance needs in advance. With this information, we can notify the customers of the pending requirement and help improve the uptime on their machines. As we grow with this data, we will continue to find ways to help improve their operations with JBT equipment.”
Pawluczyk adds that many different industries (automotive, aerospace, advertising) are already benefiting from effectively analyzing and using the massive datasets they’re able to access. “The food industry has an exciting opportunity to benefit from learnings in, and tools built for, these other industries. We see a huge opportunity for the implementation of AI and machine learning in optimizing processes in a food production plant. In an industry that traditionally operates at very large volumes, moderate margins and significant potential for waste, any process improvements will directly impact the bottom line. Further, these changes can make food more consistent, healthy and desirable to the consumer.”
She also says they see the meat processing industry going through a significant transformation as a result of multiple pressures, including stricter regulations on foreign object contamination, higher expectations from consumers, and labor shortages in the industry—even before COVID.
“Technology like PPO’s hyperspectral imaging system, and the AI that underlies it, has a vital role to play in helping the sector become more efficient and enabling it to deliver safe and high-quality products to the end consumer,” Pawlucyk says. “Automation of repetitive tasks like inspection also means plants can make better use of their most scarce and valuable resource: their people.”
Smart packaging's place in the visualization of production


Smart packaging is another way to collect data and make it useful. I spoke with Justin Picard (left), co-founder and CTO, and Tim Hadsel-Mares, regional director APAC, at ScanTrust, an enterprise cloud platform providing a suite of SaaS tools to help companies digitalize their physical goods, secure their supply chain, engage end users, and develop actionable insights from big data. This Q&A has been edited for style, length and clarity.
Sharon Spielman, Food Engineering (SS): Tell me about Scantrust’s data management system and what it is designed to do for food and beverage processors.
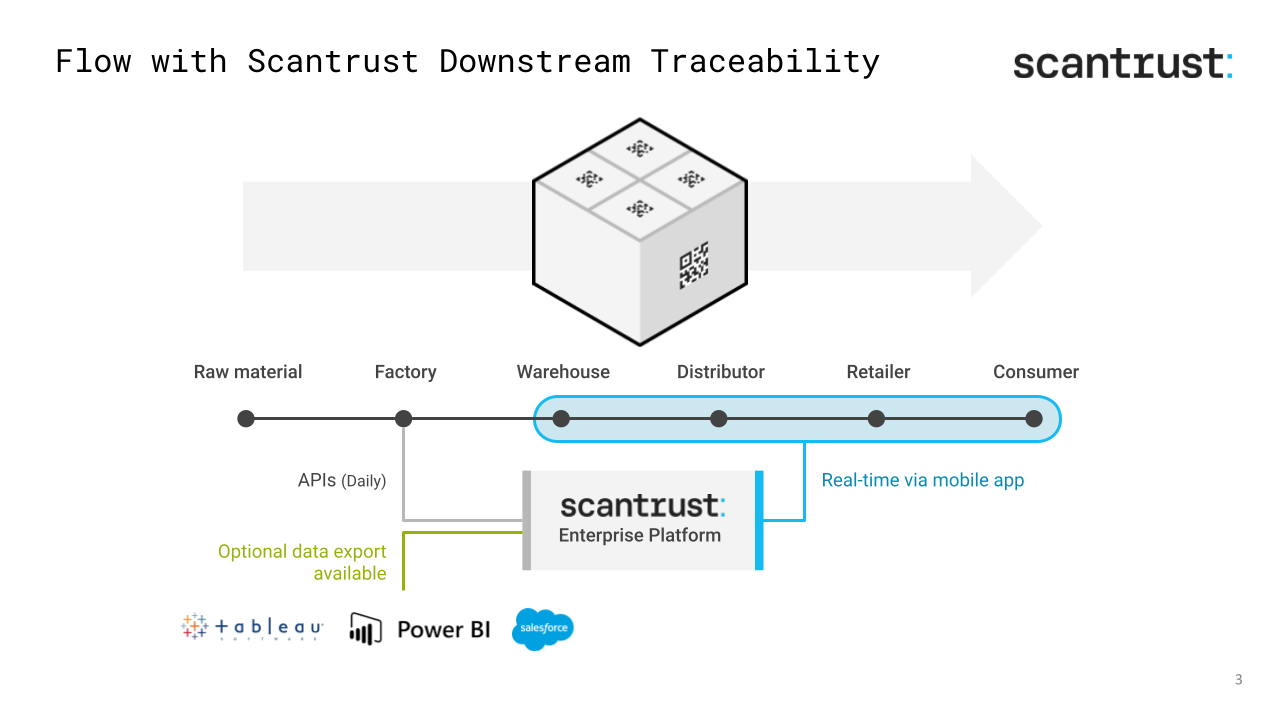
Tim Hadsel-Mares (TH): The Scantrust system is designed to capture or collect existing information in processors’ supply chains, and link this data with the unique identifiers printed on the packaging (e.g., in the form of QR codes). This allows for relevant data to be shared with consumers, who can receive targeted and segmented messaging. Supply chain managers also track the route to market in terms of location and duration.
SS: How long has this technology been around?
Justin Picard (JP): QR code technology itself has been around for 20+ years. However to be used effectively on food packaging, you also need variable data printing (VDP), a technology which has progressed tremendously in the last 10 years. VDP allows you to print different data (e.g., text, 2D barcodes) to differentiate each item. The last piece of technology is a connected packaging platform, which allows to collect and store relevant data along the supply chain, to associate it to each individual product, and in turn to make this data available for track and trace, brand protection, and marketing purposes. Indeed, in contrast to a traditional serialisation system which statically encodes formatted production data in a GS1-compliant barcode, dynamically storing data in a connected packaging platform allows for collecting product-relevant data as it moves along the supply chain. And when the barcode is scanned, a customized response relevant to the type of user and his information needs can be provided by the connected packaging platform, something that traditional serialisation systems cannot do.
SS: What can processors do to use the data collected?
TH: The data is used to measure time to market by batch, update messaging for consumers for any expired product, view engagement by region and consumer segment, and improve ecommerce links.
SS: What do you find the biggest challenges to be for food and beverage processors when implementing a way to manage their data collection? How are these overcome?
TH: Deciding who will use the data, and how they will access it. Do they use existing data analysis tools or something new? What are they supposed to learn? Implementing unique ID printing is challenging for high speed printing based on plate technology. Hybrid plate-digital printing technology can overcome this challenge and so can other, more cost-effective full-digital options.
SS: What trends do you see in the pipeline for processors to utilize the data they collect?
TH: Data from smart packaging programs, e.g., consumer behavior, reactions, feedback, etc., will be used to supplement input for product and flavor formulation. For R&D, it will help in reducing the time to market and improving probability of product success. Route to market time by batch is known and can be input for more efficient production schedules.
SS: Are there any emerging technologies that you want to talk about when it comes to managing data collected by processors?
TH: AI tools to analyze the data and make predictions, detect anomalies, and recommendations on how to optimize food products and their packaging.
SS: Anything else you would like to add?
JP: Collecting the data and ensuring its integrity is a challenge in itself. Data can come from multiple sources: it can be manually entered, collected automatically by connecting to other systems, or captured via sensors, etc. In each situation, there is a risk of unauthorized manipulation, or simple data entry errors. When the data is manually entered and a signature of the data is stored on a blockchain, technical mechanisms must be put in place to ensure that the data is entered by an authorized user, and that it is correct.
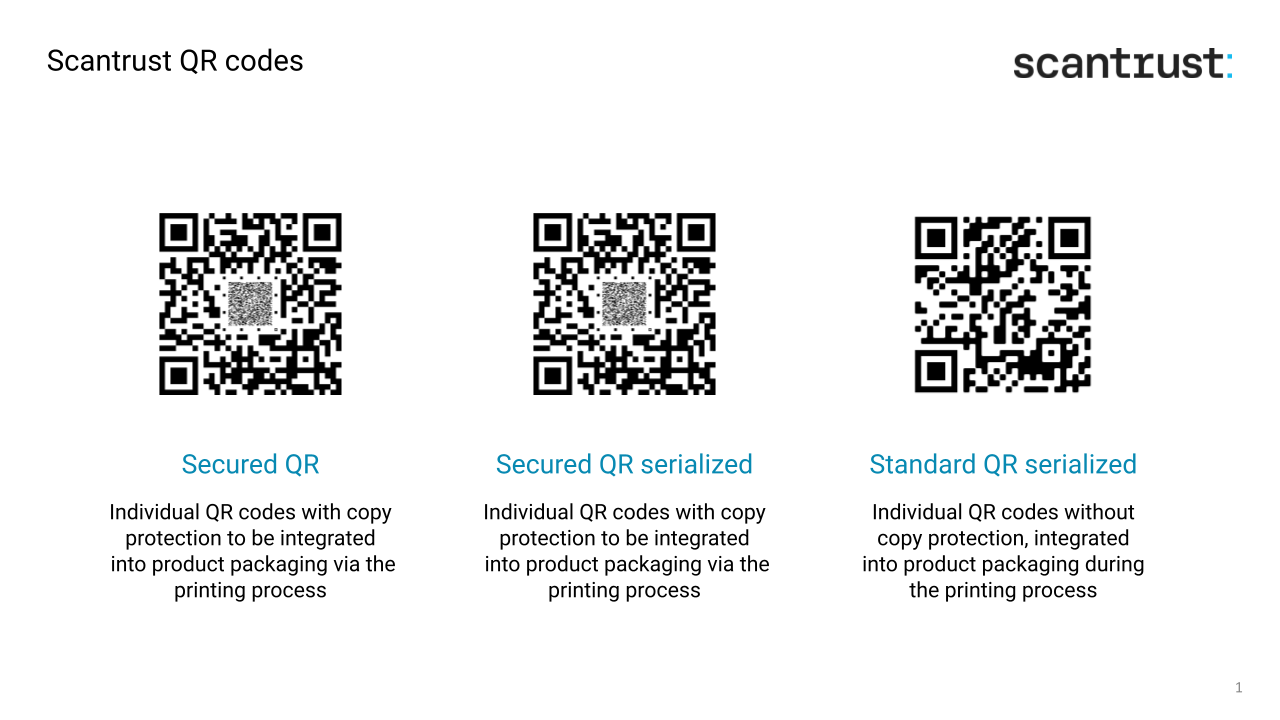
Ultimately, someone scanning the QR Code on a product needs to be confident they can trust the result, and that they won’t consume or end up using a counterfeit. But QR Codes can be easily copied by counterfeiters. To address this problem, Scantrust offers a patented, secured QR code with intrinsic protection against counterfeiting. If a consumer scans a copy that looks like the real thing, he or she will know instantly whether it is fake or not.
Read More/Read Less
For more information:
Elemica, www.elemica.com
Bakery on Main, www.bakeryonmain.com
Buhler Group, www.buhlergroup.com
Hydrofresh, www.hydrofreshhpp.com
Infinity QS, www.infinityqs.com
JBTAvure, www.jbtc.com
P&P Optica, www.ppo.ca
ScanTrust, www.scantrust.com
Looking for a reprint of this article?
From high-res PDFs to custom plaques, order your copy today!