Manufacturing News
Study reveals attributes of top organizations
The percentage of minor stops increases proportionally to the total downtime as OEE increases. Source: Epicor/Analysis by Sage Clarity.
A new study from Sage Clarity (an Epicor/Informance solution provider), “Manufacturing Performance Benchmark Study for Fast Moving Consumer Goods,” features real-world data collected over a period of 90 days from more than 100 global manufacturing operations.
Sage Clarity, working with Epicor/Informance and its customers who agreed to participate in the blind study, collected actual manufacturing data to analyze numerous KPIs—real values that show how best-in-class (BIC) manufacturers perform compared to average performers and the laggards.
“Companies that run the most productive manufacturing operations have learned how to use technology to accurately identify and minimize downtime, both big and small,” says Paul Ellis, vice president, sales, Epicor Solutions Group. In this study, BIC manufacturers rank in the top 25 percent of performance levels or OEE. Average companies rank in the middle 50 percent, and laggards rank in the bottom 25 percent. The study found BIC and average organizations exhibit OEEs twice those of the laggards.
“When manufacturing leaders estimate their OEE numbers, reality often surprises them,” says John Oskin, Sage Clarity CEO. “Every minute of an operation was measured, including downtime, performance throughput and numerous other elements,” explains Oskin. “Then, all the information was analyzed, and behaviors of different levels of performance were correlated; we have over 25 KPIs in the study.” Downtime is crucial, and BIC companies have identified 99.9 percent of downtime causes, while average manufacturers know 98.2 percent of downtime causes, and laggards account for 26.3 percent of the causes for their downtime.
“What we found is knowledge is power,” adds Oskin. “Companies that measure downtime to deep detail achieve high OEE levels; they know where their problems are. Lower performers do not identify losses well, hence, exhibit lower OEE values.” When unrecorded downtime is correlated with OEE, BIC manufacturers know where 99.5 percent of the day went, says Oskin. Average companies can’t account for 6.3 percent of a day’s downtime, whereas laggards have no idea what caused 15.7 percent of their downtime. The knowledge factor sets BIC manufacturers apart from laggards by a ratio of 30:1.
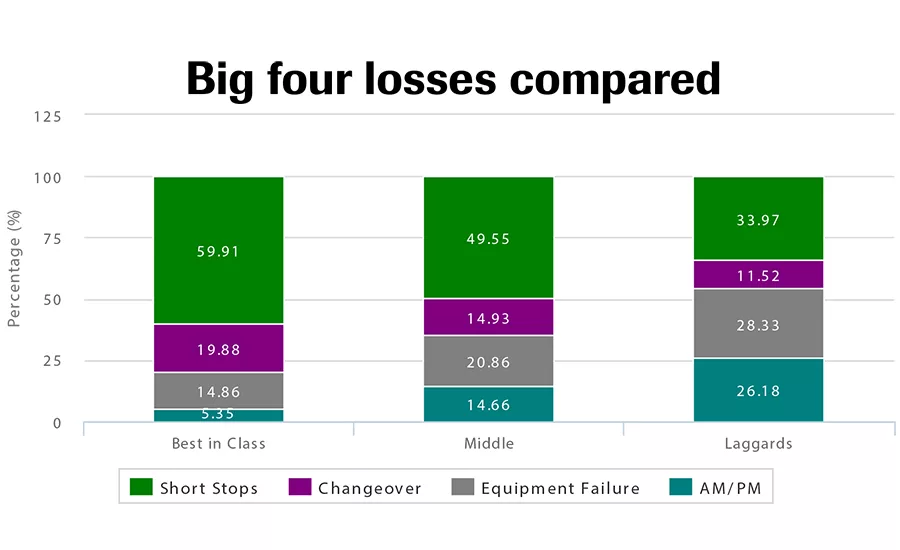
For this study, researchers categorized downtime—which could be caused by a number of factors—in standard capacity loss “buckets,” known as the Big Four Losses:
- Short stops/minor stops—downtime event that is unplanned and shorter than 10 minutes in duration
- Changeover—capacity lost during changes in material, equipment or product
- Equipment failure—equipment unexpectedly becomes dysfunctional or inoperable
- Autonomous maintenance and preventive maintenance (AM/PM).
When these downtime causes are compared among the three groups (BIC, average and laggards), a seemingly unexpected result occurs, notes Oskin. “Short stops for the laggards are 33.97 percent of the [down]time; short stops for the BIC group are actually 59.91 percent, which is counterintuitive.” Oskin says the anecdotal reason appears that once the laggards overcome the issues of low-hanging fruit—equipment failure and maintenance—the short stops never go away and appear to increase as other less obvious downtime causes are diminished. Conversely, BIC facilities tend to make eliminating major downtime causes their first focus.
Even while BIC facilities show a large percentage of short stops compared to the laggards, the study found BIC facilities spend on average of 3.62 hours loss per 24-hour day due to short stops, while the laggards spend 6.08 hours a day. But, the story doesn’t end there. For laggards, when equipment failure and AM/PM are added to the equation along with changeover, laggards lose as much as 17.9 hours a day on all four buckets of downtime; BIC manufacturers lose on average 5.7 hours a day. Meanwhile, average facilities lose 13.4 hours on downtime a day. When breaking out short stops or minor stops from the big four losses, BIC facilities on average have half the amount of scheduled time lost compared to the laggards.
The study recommends manufacturers with OEEs greater than 70 percent focus on reducing causes that are creating most of the short stops, which should improve availability. For those with OEE scores between 30 and 50 percent, focusing on tagging downtime to provide better clarity of its causes is recommended, in addition to reducing the amount of equipment failure. For manufacturers with OEEs between 50 and 70 percent, gains can be made by reducing short stops to improve availability and eliminate equipment failure.
For more information, contact john.oskin@sageclarity.com, www.sageclarity.com.
Looking for a reprint of this article?
From high-res PDFs to custom plaques, order your copy today!