Continuous Improvement
Got waste? Check, analyze, plan, do!
Learn how to leverage the process and tools in your company to reduce waste to not only meet but exceed your customers’ expectations.

ConAgra Foods is leveraging the CAPD process to address waste issues. Source ConAgra Foods.

Value stream mapping (VSM) is an effective lean tool when you want to examine end-to-end supply chain losses. Source ConAgra Foods.
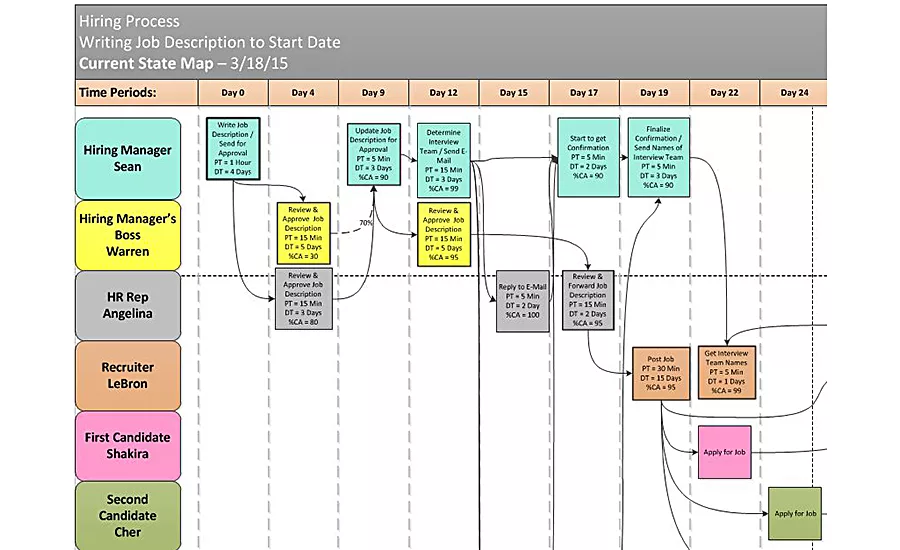
Swim lane process mapping (SLPM) is a tool tool that has some similarities to VSM, such as a cross-functional team, creating current and future state maps, and highlighting quality issues. Source: ConAgra Foods.
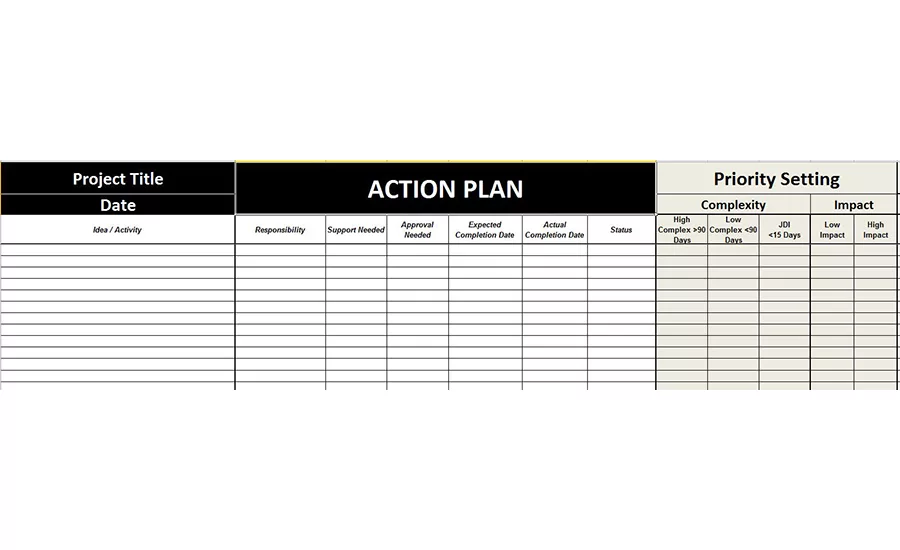
The action planning template should provide a clear description of activity, owner, support needed, approvals needed, expected completion date and a section for updates. Source: ConAgra Foods.
It’s not uncommon to experience frustration in the manufacturing world when things don’t go well, when costs are higher and quality is lower than you’d like and when you can’t seem to meet your customers’ requirements. This frustration is often due to waste, such as rework or delays, found in any operation resulting in negative impacts to costs, quality and service. The good news is there are ways to address this waste.
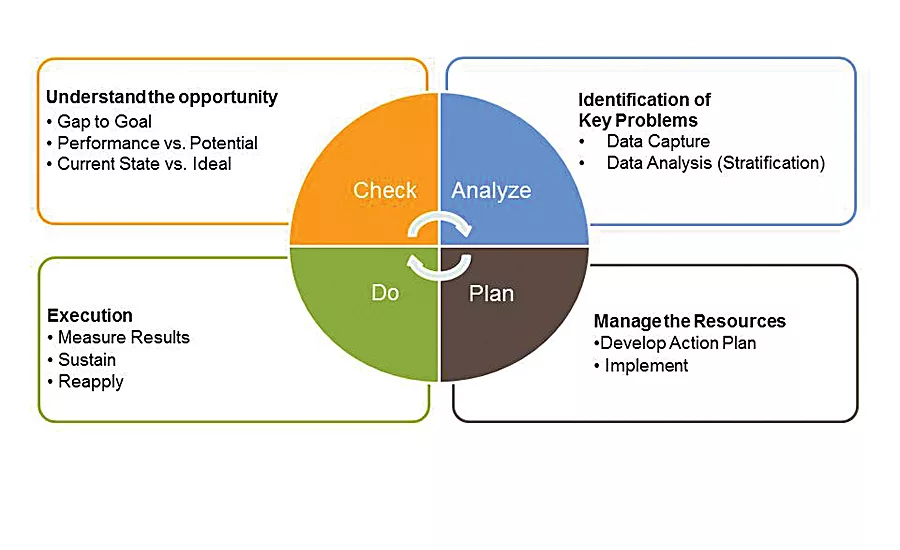
In our organization, we are leveraging the CAPD (check, analyze, plan, do) process to address waste issues. See illustration on page 40.
In this article, you'll learn how to...
- Check for opportunities for improvement
- Analyze your operations
- Plan: Set a course of action and implement it
- Do: Ensure that your action plan is working
Step 1: Check
In the “Check” step, we want to see if an opportunity or problem exists. We look for gaps against our targets. Throughout this CAPD discussion, I’ll use the analogy of your health. Let’s say you’re feeling feverish. When you take your temperature, you see that it is over 100 degrees. This verifies that there is a problem. In manufacturing, there are numerous ways to see if you have a problem or opportunity.
One way is examining your key performance indicators (KPIs). Are you hitting your goals or falling short? Shortfalls may indicate an opportunity for improvement. I say “may” because you could be missing your targets due to some normal variation in your process. This brings us to the idea of “triggers.” Instead of chasing every “red” metric, you want to establish triggers that in turn cause an action. For example, if my yield loss target is 5 percent, I may establish triggers of 5.5 percent or above 5 percent for six days in a row. So, if I have a day that comes in at 5.3 percent, no action is required, even though I am worse than my goal. If I have a day where yield loss is 5.8 percent or six days where I surpass my 5 percent goal, I need to take action because a trigger has been tripped. That action should be defined up front. In this case, let’s say we are called to conduct a simple root cause analysis. This is a problem-solving tool used in many companies.
Another way to “Check” for opportunities of your current performance is to gap to your potential or ideal state. At ConAgra Foods, we leverage zero loss analytics (ZLA). ZLA quantifies waste against a theoretical zero loss basis. What does perfect look like, and how do we gap against that? Zero loss sounds like perfection. As the great Green Bay Packers Coach Vince Lombardi said, “Perfection is not attainable, but if we chase perfection, we can catch excellence.” ZLA gives you that aspirational goal and shows you how far you are from achieving it.
Step 2: Analyze
Numerous tools can be used for analyzing an opportunity, such as value stream mapping, simple root cause analysis, spaghetti diagrams, etc. It may be a matter of taking a deeper dive into the data that you have. For example, in “Check,” I realized that my yield loss is below my goal. In the “Analyze” phase, I may look at individual pieces of equipment to see where it might be occurring. I may look at my operation by shift, product type or operator. With any analysis tool, you want to get to information which is actionable. If the analysis is conducted at too high a level, any countermeasures or actions may be ineffective and/or a waste of time.
Another “Analyze” method is examining the eight wastes that exist in operations. The acronym we use is called “DOWNTIME:”
- Defect
- Overproduction
- Waiting
- Not Utilizing People
- Transportation
- Inventory
- Motion
- Excess Processing.
Defect is when something doesn’t meet a customer’s expectations or standards. That could be an external or internal customer. Something is wrong with the product or information. The result is often inspection and/or rework. What a waste! Numerous things can cause a defect including failure to identify or meet “Fitness for Use” criteria. Fitness for Use can be defined as the effectiveness of a design, manufacturing method and support process employed in delivering a good, system or service that fits a customer’s defined purpose, under anticipated or specified operational conditions. Defects not only cost you money, they can cost you customers as well.
Overproduction is when you are making more, earlier and/or faster, than is required by the next process. We mostly associate this with products and manufacturing. So, why would people do this? It could be cost related—bigger batches can reduce the unit costs. Maybe it’s due to incentives—you get recognized for productivity numbers, so you keep running as fast as you can regardless of downstream demand. Another possibility is your plant is not balanced, so there are operations that are out of sync with others.
Overproduction can also apply to non-manufacturing areas. Examples would include the following:
- Too many meetings
- Expensive, overly fancy meetings
- Meetings that are excessively long, have too broad a focus and/or don’t generate progress or work product
- Unnecessary web content
- Reports and analyses that don’t provide value and/or involve unnecessary people
- Excess copies of reports and publications.
Waiting is probably the waste most of us can readily identify and relate to. This is idle or non-productive time due to waiting for something—it can be information, maintenance, supplies, authorization, labor, transportation, participants, etc. This non-value added waste is costly and frustrating. Other examples include the following: interruptions in the flow of business processes; wait time in queues between process steps; wait time for resource availability; process delays due to resource schedule constraints; delays in communication, data availability, reporting and analysis; long cycle times for data refresh, data processing, work process, report generation, etc.; and delays in meeting start/finish times.
Not utilizing people is a waste ignored by companies sometimes. Some organizations know they have the other seven types of waste, but forget to include human resources. At our organization, we feel this waste is important enough to highlight. What is it? Basically, it’s not utilizing the skills and talents of your employees. It may be that you don’t include them in a problem-solving event or process improvement activity. It is easy to fall into the trap of thinking those employees are too busy making product, and they don’t have time to work on a project. However, ignoring them adds waste as critical information and experience are not used, and implementation is hard to sustain without the buy-in. This waste is combated by high employee involvement or engagement and management changing their paradigms and acting as servant leaders.
Transportation is often associated with moving product. There can be a significant amount of waste in moving materials within a plant, between locations, from suppliers and to customers. It’s not uncommon to see lift trucks moving around a plant with nothing on their forks or empty trucks being transported to locations.
Inventory can be another hidden waste. There can be reasons to keep lots of inventory on hand— to ensure production doesn’t run out of materials, help with customer fill rates, you have plenty of space or found a good bargain on supplies. However, excess inventory is costly as it ties up money that could be spent elsewhere—such as on innovation, paying down debt, advertising, talent acquisition, capital improvements, etc. Inventory refers to non-finished goods (raw and packaging materials and machine replacement parts), semi-finished goods (work in process) and finished goods. Wall Street looks at working capital management closely as it reflects how you are managing your cash flow. Inventory also refers to non-manufacturing areas such as excess and/or outdated information on shared drives or websites and excess office supplies.
Motion is sometimes confused with transportation, but it’s very different. Motion refers to the movement within a process (versus between processes). In an office environment, it can be excess movement due to poor arrangement resulting in long walks to the copier or meeting rooms. It could also be bad workplace arrangements requiring excess movement of a person’s limbs, eyes, head or body. In manufacturing, an inefficient work cell plan, line design or plant layout can lead to excess motion. Proximity to tools, support departments and supplies should be reviewed to see if motion is a waste.
Excess processing means doing more than is required by your customer (internal or external). It takes resources and time and is not adding value from a customer’s perspective. Redundancy may be taking place in operations due to a lack of reliability (such as ink jetting a date code or banding and stretch wrapping a pallet). Packaging and quality are good areas to review for excess processing. With respect to service areas, activities such as multiple approvals, collecting unnecessary or unused data, numerous mouse clicks to get to information and redundant meetings are a waste.
So, you “checked,” and it looks like there is a loss, waste or opportunity. In our health analogy, you “checked” your temperature and see that you have a fever. Now, further analysis is needed to figure out what is causing your illness. The “Analyze” step is basically peeling back the onion to understand better the underlying root causes for the problem. This is where we leverage more lean tools and methodologies. Let’s take a look at a few of them.
Value stream mapping (VSM): This is an effective lean tool when you want to examine end-to-end supply chain losses. A value stream includes all the steps, both value-added and non-value-added, required to deliver a service or product. The simple distinction between value-added and non-value-added is whether or not the customer is paying for this activity. If you’re changing the form, fit or function of something to satisfy a customer request, there is a good chance you’re adding value.
VSM is a high-level look at the material and information flow across the value stream. It gives you a good idea of timing, inventory levels and quality issues. A current state is first created to gain alignment on how activities occur today. VSMs often involve a cross-functional team and increase their appreciation for how their work affects others and educates them on what other functions are doing. Ultimately, this team wants to create a future state and possibly an ideal state. The gaps between these and the current state generate an action plan to improve the value stream. See pages 40-41 for an example of a VSM current state map.
Swim lane process mapping (SLMP): The mapping tool that has some similarities to VSM such as a cross-functional team, creating current and future state maps and highlighting quality issues. SLPM is used when you want to understand the interdependencies between areas, improve role definition and improve timing of a process. SLPM can be used easily in support areas as well as manufacturing. We have used it to improve the preparation for executive quarterly talks, sales communication, graphic art changes and closing process orders. We capture processing time (PT), delay time (DT) and percent complete/accurate.
An example of an SLPM is shown on this page. Simple root cause (SRC): When you have a problem and are unsure what’s causing it, simple root cause analysis can help. SRC is a simple and effective structured problem-solving process that involves:
- In-depth investigation and analysis of a system or process to understand the problem
- Identification of the primary cause(s) of a problem for effective resolution
- Implementation of countermeasures that result in a permanent solution.
It is a systematic and consistent approach that solves problems and eliminates losses ... PERMANENTLY. To effectively solve a problem, we must change how we think about it. Asking “What is going on?” drives clarification, order and priority setting. Asking “Why did this happen?” drives understanding of cause and effect. Asking “What/Which course of action should be taken?” drives us to prevention versus reaction. Depending on the problem, SRCs could take less than an hour to a couple of days.
Time Studies: Conducting a time study is still an effective tool when trying to improve process flow, labor utilization, work area layout, cycle time and safety. Using a stop watch, writing down tasks and drawing a spaghetti map reflecting the movement of a person helps you identify waste.
These are just a few of the tools you can use during the Analyze phase. Tool selection is dependent on the nature of the problem. In some cases, you may use more than one.
Step 3: Plan
Once you’ve drilled down far enough, you can begin the “Plan” stage. This stage is fairly self-explanatory—you are going to build a plan. Back to our illness example, once the physician has analyzed the problem, she will set a course of action: medicine, therapy, exercise, surgery, etc. It’s important to have a robust plan to ensure you take care of the problem and prevent it from reoccurring. At the end of this step, you should be implementing or doing the plan.
There are several characteristics to a robust plan. Unless it’s a very simple solution, it is important to get it documented. The plan should provide clarity on the following items: clear description of activity, owner, support needed, approvals needed, expected completion date and a section for updates. In our action planning template, we have added a few other sections. “Priority Setting” helps us in determining sequencing and resourcing. It is helpful to think about the idea from a “complexity” and “impact” standpoint. For complexity, look at how long you think it will take to accomplish this action. In the example shown on this page, you see “High Complexity >90 days,” indicating this activity will take at least 90 days to complete. There is another classification of “JDI” which stands for “Just Do It.” Those are quick-hit items that could be implemented in 15 days. You may choose to adjust these cut-off days depending on the scope and depth of your project/problem.
The dimension of “impact” is more subjective—remember this is simply a prioritizing tool. The team needs to determine if this activity will have a high impact on the problem/improvement—it’s a big deal, moves the needle, saves significant time or money, creates a major change in safety and/or quality, etc.
After you classify each idea/activity, you can sort this list by JDI, High Impact, Low Complexity. This will bring the biggest, easiest opportunities to the top.
Even though the name of this stage is “Plan,” this is also where we implement the plan. Action, as outlined in the plan, is taken to improve the situation. There is clarity on ownership, stakeholders and completion date.
Step 4: Do
The fourth step in the CAPD process is “Do.” You might think this is where implementation takes place, but that happened in the “Plan” stage. In “Do,” you are checking your results, ensuring that sustainment is occurring and, if possible, reapplying your learnings. In our illness example, you might be weighing yourself, keeping up on your medications, attending physical therapy, etc.
This can be the most challenging step. It requires good change management skills and discipline. You may have to put audits in place, leverage visual management, make your implementation project an agenda item at regular meetings and provide positive recognition when your plan is being sustained.
Continuous improvement is an exciting, vital part of running operations. Hopefully, this article has given you some ideas about how to leverage the process and tools in your area to reduce waste.
Looking for a reprint of this article?
From high-res PDFs to custom plaques, order your copy today!