Operational Insights
Benchmark plant processes to become competitive
There are plenty of tools—especially lean manufacturing— that can be used to cut waste and improve productivity. Knowing which to use can be a challenge.
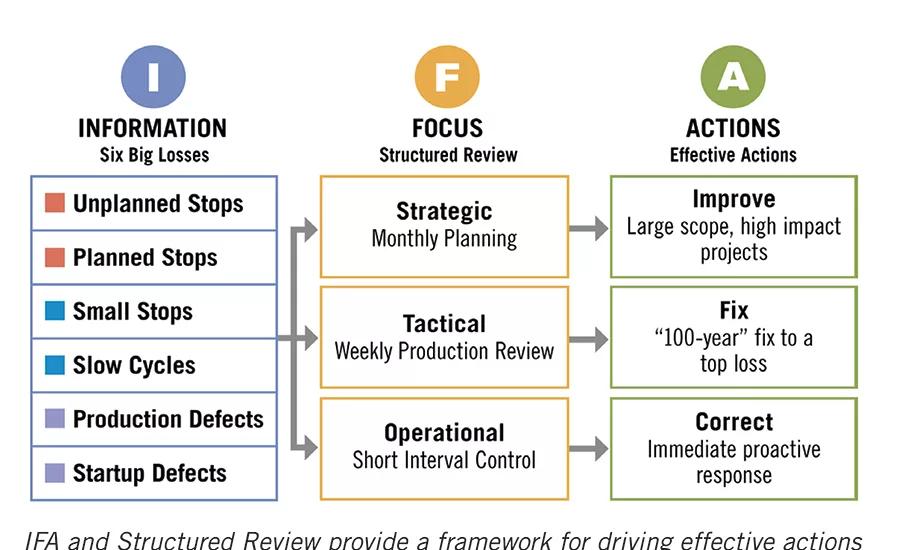
The “six big losses” from the world of TPM, part of lean manufacturing, can be approached using Vorne’s IFA method, where IFA and structured review provide a framework for driving effective actions across all levels of a company. Source: Vorne.
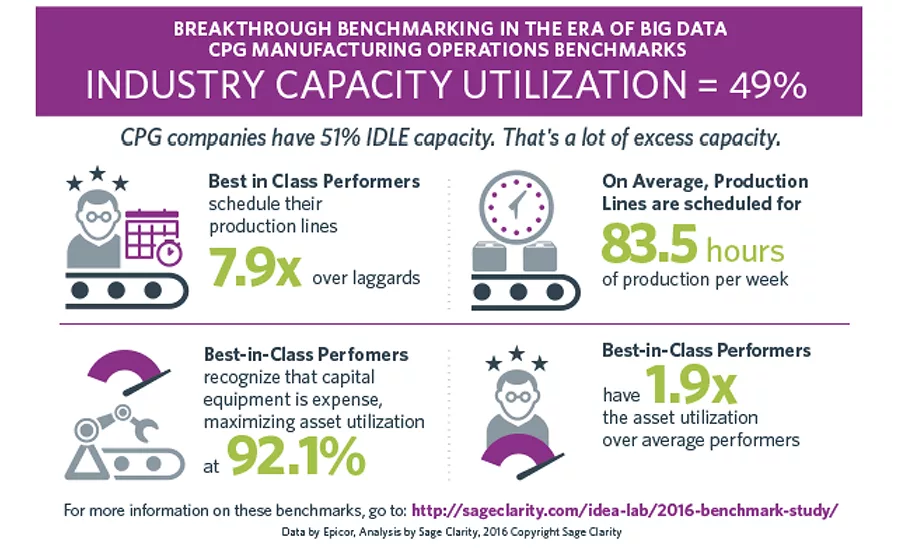
Sage Clarity’s “Manufacturing Performance Benchmark Study for Fast Moving Consumer Goods” found that 51 percent of CPG companies have idle capacity, but best-in-class performers maximize their asset utilization at better than 92 percent. Source: Sage Clarity.
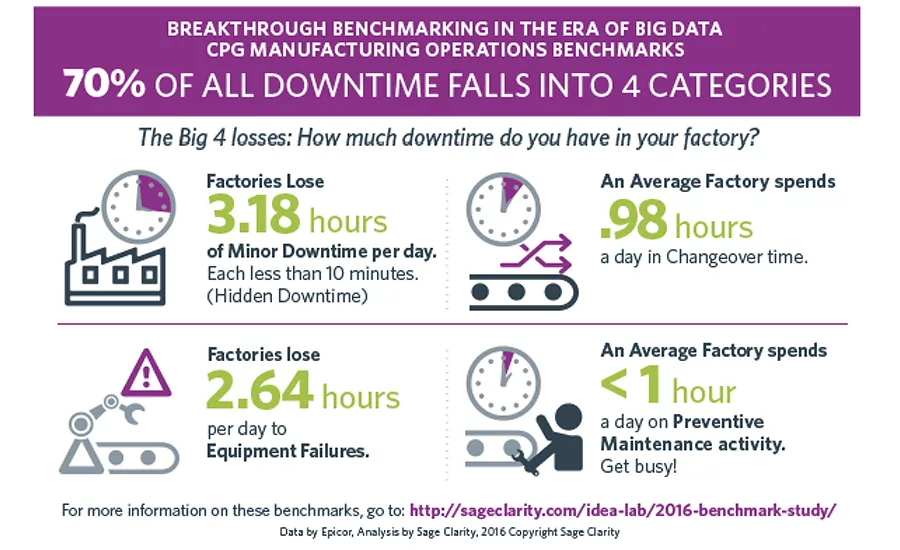
Seventy percent of all downtime for CPG companies participating in the Sage Clarity real-time survey occurred in four areas: minor downtime (hidden), equipment failures, changeovers and preventive maintenance activities. Source: Sage Clarity.

In this year’s FE “State of Food Manufacturing Survey,” 40 percent of food and beverage manufacturing respondents reported implementing lean manufacturing systems to benchmark and improve their operations, while 41 percent reported having a Total Quality Management (TQM) system in place to better their processes. While TQM isn’t specifically part of lean, following a lean system rigorously can certainly improve quality. Nearly a third of FE survey respondents reported using Six Sigma practices, and nearly a third reported using Total Productive Maintenance (TPM) systems—part of lean tools—to improve their operations. While these numbers add up to more than 100 percent, many respondents reported using more than one system or strategy to hone their operations.
While both TQM and lean manufacturing aim to improve quality, TQM reaches a point where no more improvements can be made. Lean manufacturing, however, focuses on taking quality improvement to the next level. While TQM typically views quality as conformance to internal requirements, lean manufacturing focuses on reducing the number of defects and waste. Therefore, quality will improve. But, while TQM can be managed internally, implementing lean manufacturing usually requires some outside help and/or software. But, the good news is there’s plenty of help in terms of training and consulting, besides various ERP and MES software systems, that are capable of implementing some of the lean tools.
Vorne provides an introduction to what it calls the top 25 lean production tools at www.leanproduction.com/top-25-lean-tools.html. Perusing the tools, you’ll find ones that you may already be using. For example, some of them are:
- Andon: visual feedback systems on the plant floor to show operators production status
- Kaizen: a strategy for continuous improvement
- Kanban: a method of regulating the flow of goods within the plant and within the supply chain
- KPI: key performance indicator[s] track and encourage progress toward critical organizational goals
- Muda: waste—anything in the manufacturing process that does not add value from the customer’s perspective
- OEE: overall equipment effectiveness—framework for measuring productivity loss for a given manufacturing process
- TPM: Total Productive Maintenance—a holistic approach to maintenance that focuses on proactive and preventative maintenance
- Value-stream mapping: a tool used to map visually the flow of production—shows the current and future state of processes in a way that highlights opportunities for improvement
- 5S: Sort—eliminate that which is not needed; Set In Order—organize remaining items; Shine—clean and inspect work area; Standardize—write standards for above; and Sustain—regularly apply the standards
Since lean manufacturing encompasses many of the key performance metrics you’ll use to benchmark your processes, we’ll look further into the prerequisites to adopting a lean manufacturing strategy and find tools that are helpful in implementing it. Though lean doesn’t necessarily require software tools, there are numerous software tools available to support lean strategies to benchmark your processes, for example KPIs and OEE.
Getting started
Whether you’re anticipating using lean or another strategy or a combination, realize that it will require a total commitment of everyone in your company—from the CEO to mid-level management and plant team members. Big changes could be in order. Dr. Gunter Beitinger, VP manufacturing, Siemens AG (Siemens Guadalajara) gives some advice in a paper entitled, “The Five Fundamental Jigsaw Pieces for Successful Lean Implementation.”
Before you get started with lean workshops, it is important to review how the previous leadership culture has shaped the work environment. The work environment employees are exposed to defines how they will react to the lean implementation. Lean is a cultural change within an organization.
“We strive to instill these new values so that the lean transformation does not wither away once a project has ended,” says John Spillson, food business development manager at the Michigan Manufacturing Technology Center (MMTC). “Top management often is required to be part of the kickoff to any project to show that they are on board with the change and embracing it.”
Celebrating its 25th year as a Manufacturing Extension Partnership (MEP) center, which was created by the US Department of Commerce after the passage of NAFTA, MMTC was developed to help local companies grow and compete to keep jobs from leaving Michigan as well as the US, says Spillson. MMTC focuses on changing a company’s culture to one that embraces innovation and continuous improvement. Taking MMTC’s “LEAN Champion” course is not just a two-day commitment; it’s actually an eight-day, in-depth overview of everything lean.
“The vast majority of our teachings focus on maximizing efficiencies, reducing downtime and eliminating waste,” says Spillson. “These are the three most important components that add dollars to the bottom line. We often prefer to lead with 5S because without 5S, you really can’t do lean. Once a firm 5S program is in place, a safer, more efficient work environment is established. 5S is the backbone of a lean implementation.”
While we all want good results from the strategy we implement, it’s easy to get hung up on the results without giving a lot of thought to how we got those results in the first place. Another way to say it, according to Adrian Pask, Vorne management analyst, is: Most companies place too much emphasis on results (looking backward) and too little emphasis on the factors that actually drive results, which are: Information (I, the basis for decisions), Decisions (D, making effective decisions) and Action (A, transforming decisions to results). This is what Vorne calls the IDA strategy. Vorne maps out an IDA equation that looks much like OEE, where R (results) = I × D × A.
“This strategy demonstrates that information (such as OEE) is only so valuable as how it is used—all improvement is created by people making decisions and taking action based on excellent information,” Pask says, and notes how OEE is frequently misused as managers tend to look at scores first—and process second—all too often, comparing scores of different processes or lines. “In our opinion, the value of OEE is that it categorizes your losses and provides a simple score to track how a process performs over time.
“As soon as you start using OEE to compare dissimilar processes, or lines with dissimilar production schedules, then it no longer makes sense to compare OEE scores because you’re not comparing ‘apples with apples,’” he adds. “As an example, I’ve worked on filling machines with high product mix (and lots of changeovers), which are running amazingly at 40 percent OEE. I’ve worked on identical lines with two or three products (and very few changeovers) that run appallingly at 87 percent. So, which of these two processes is closest to ‘world class?’
“Our recommendation is to let go of the need to find external benchmarks and, instead, use OEE to set incremental improvement targets to reduce your OEE losses and drive change within your organization,” says Pask.
Establishing benchmarks
“All manufacturing companies should have benchmarking metrics established that measure how the company is performing in terms of safety, quality, delivery, cost and morale [SQDCM],” says Rob Stauffer, MMTC lean program manager. “In terms of food manufacturing, safety has two components. One component is employee safety, while the other is ensuring the safety of the food itself.” (For more metrics, see the box, “Manufacturing benchmark metrics based on SQDCM.”)
“In terms of employee safety, you want to have the means to insure that you have the ability to confirm that an employee has been trained on a specific piece of equipment before they are assigned to work with it (or in the case of maintenance, repair it),” says Mike Edgett, Infor industry & solution strategy director. “Additionally, you want very specific KPIs for your business so you can not only see what is going well, but what is going wrong, ideally before it becomes a critical issue. For example, if you are running a food plant that is producing short-shelf-life products, you want to have quick visibility to changes in orders [and] partners relative to your forecast or historical patterns so you don’t end up over- or under-producing.”
“Our solution contains a subset of best practices, but we prefer to start with what is important to the customer,” says Roy Thomas, Aptean principal solutions consultant. “We start by understanding the metrics that are most relevant to them—as in, what do they use now? We then apply our knowledge to enhance the metrics they track while also suggesting additional metrics that could bring value to their operation. When it comes to food and beverage, I believe that productivity and quality are most important. For example, you might be running at 90 percent efficiency, but you might be wasting 10 percent of your product because of quality control issues, so our solution takes both factors into consideration.”
Sage Clarity has deep domain expertise in the food and beverage industry.
“In 2016, Sage Clarity benchmarked over 20 manufacturing KPIs, including OEE, to identify best-in-class, average and laggard performance in the food and beverage sector,” says John Oskin, president. “Most benchmark studies are survey based. The Sage Clarity benchmark is based on real-time data [see FE March 2016]. It is the only benchmark of its kind.” This study actually accumulated live production data from Sage Clarity users who volunteered to provide blind (anonymous user company) real-time data on their processes.
Continuous improvement (kaizen) is a lean tool that all manufacturers should strive toward making part of their culture. In the May 2016 issue of FE, Craig Andrews, senior director of continuous improvement, described ConAgra Foods’ approach to continuous improvement using a four-step process called CAPD, short for check, analyze, plan, do. Checking your KPIs is one way to get a handle on losses, and another good check for opportunities to improve your current performance is “to gap your potential or ideal state.” The ideal or theoretical goal is zero loss, which sounds like perfection. While it’s not always possible to attain perfection, if you go after it, you may at least attain excellence.
Andrews suggests another lean tool that is good for benchmarking. Value-stream mapping can be used to examine end-to-end supply chain losses. It includes all the steps—both value added and non-value added—required to deliver a service or product.
“Our team utilizes value-stream mapping, a common technique used in lean manufacturing exercises, to assess the current state of operations and identify steps that add value and those that don’t,” says Todd Allsup, vice president, food and beverage facility services at Stellar. “It then identifies potential areas for improvement and proposes a future-state of manufacturing operations that optimizes workflow.”
Future-state analysis is a tool used to evaluate where value-added steps are and what steps are a work in progress (WIP). To arrive at solutions, it’s important to challenge the status quo and propose new ways of dealing with a historical issue.
“Often overproduction creates a wasteful environment where inventory levels hide inefficiencies. Looking at pull systems—rather than push systems—for inventory control can impact total delivered cost of your products,” adds Allsup.
Historical data vs. live data
In ConAgra’s second step (analyze), it’s necessary to make use of data collected from equipment to determine, for example, the reason for yield losses, though Andrews warns about conducting an analysis at too high a level. Instead, you want close-to-the-process actionable data from an analytics tool. We could get philosophical here, but there’s been some discussion on just how valuable historical data is vs. real-time data. In the context of controls, real-time data would be used to keep a live process in control or in bounds.
“Insight from historical data is used to improve operations in many ways,” says Khris Kammer, Rockwell Automation information partner and competency manager. “Humans can learn from historical data and make changes to achieve the best result. In its simplest form, this might take the form of manual equipment adjustment based on unexpected changes in process data.”
“Once patterns are identified and characterized, manufacturers can leverage high-performance architecture solutions to execute real-time compensation algorithms for wear and drift on blenders, oven filters and other equipment,” continues Kammer. “That approach takes available data into account, but still requires humans to look into the future.”
Predictive tools can then be used to recognize patterns that might lead to process or equipment failure. These tools can notify engineers before the occurrence of expensive or catastrophic events. Both real-time and historical data are necessary to get a good picture of what’s going on at a plant.
“We recommend real-time data for benchmarking,” says Oskin. “A minimum of three months of data will provide a good baseline for a benchmark.”
“Manufacturers need to collect real-time data for every job and every shift to be able to use that information in real time,” says Thomas.
Armed with real-time information in production operations and per-unit costs, factory floor teams are able to implement immediate reviews, make real-time adjustments and measure immediate performance improvements. This actionable intelligence is made possible by bridging the disconnect between the data, information and accountability.
“Imagine the power of using historical data to predict the outcome of the shift you are about to run,” adds Thomas. “For example: ‘The last x times I ran that job/SKU, I had issues with the labeler—so it is likely that those issues need to be monitored and countermeasures put in place to prevent a downturn in performance.’”
Stellar’s Allsup suggests, “To assist in establishing the current state of operations, it’s important to collect data on uptime/downtime/changeover time, production volumes, categories of products, SKUs run on each line, number of operators and scrap rate.” Allsup also points to energy consumption and data on reliability. “If an asset is not running due to excessive breakdowns, maintenance issues or lengthy changeovers, then costs increase and profits decrease. While best-in-class companies strive to attain OEE levels in the 85 percent range, too many fall far short of those goals.”
What about OEE?
We learned earlier that while OEE is useful, it has to be applied very carefully to set benchmarks. You can’t compare apples and oranges, that is, different lines in the same plant or even two geographically separated plants if the equipment is not an identical mapping from one to the next. There’s also another issue.
“OEE is one element in looking at the overall efficiency of your business, but most food lines are really made up of multiple pieces of equipment that each has its own OEE rating,” says Infor’s Edgett. “The important thing is to determine which are the critical components (or potentially problem components) in your production line and focus on those.”
Vorne’s Pask recommends focusing OEE measurement and improvement only at the constraint (or bottleneck) step in the process. Many companies seek to measure OEE on multiple process steps and simply get swamped with confusing and poor-quality data. Pask recommends, “It is always more valuable to do a great job measuring OEE in a single location than in doing a poor job measuring OEE in multiple locations.”
“OEE is useful when comparing one piece of equipment against itself over different time periods, material lots, environmental conditions and other factors,” says Rockwell’s Kammer. “However, if you want to use it to benchmark one piece of equipment against another, or even better, one plant against another, it becomes increasingly important to define standards for how the KPI is generated.”
For example, the two entities being compared must agree on definitions for available time versus planned downtime and a good or bad production unit. Such factors can be perceived or measured differently across plants, lines, machines and even operators, but these differences must be mitigated for a real comparison, adds Kammer.
“OEE is a very performance-related metric from a productivity or speed perspective,” says Aptean’s Thomas. “OEE has its limitations, but is effective when combined with other metrics, for example, cost of labor. In a line with a number of changeovers, combining OEE with labor or cases per man-hour to measure plan versus output would provide a more holistic view.”
“OEE is a good metric if used correctly,” says Oskin. “Other useful metrics include asset utilization, capacity, TEEP [total effective equipment performance], MTBF, etc. It is worth noting that there are very few manufacturers that run the same product for a week. Our experience in the food and beverage industry is that companies are making the changeover daily, if not multiple times per day.”
Oskin mentioned the term, TEEP. TEEP, according to OEE.com, is a performance metric that provides insights as to the true capacity of a manufacturing operation. It takes account of both equipment losses (as measured by OEE) and schedule losses (as measured by utilization). OEE measures the percentage of planned production time that is truly productive. TEEP measures the percentage of all time that is truly productive.
TEEP = A × P × Q × U, where A = availability, P = performance, Q = quality, U = utilization. According to OEE.com, if your TEEP score is 100 percent, you make only good parts as fast as possible with no stops and around the clock. That is, you have no scheduled losses and no OEE losses.
TQM and lean
It would seem that TQM and lean are two separate paths toward attaining better production through eliminating waste and improving quality. Based on lean strategies, TQM can be a tool to support and create synergy for inducing a more competitive market between companies, according to a paper published by the World Applied Sciences Journal in 2011.
“TQM is somewhat outdated,” says David Bradley, MMTC quality manager. “The eight Quality Management Principles on which ISO 9001 is built contain seven TQM principles, but it goes much [further]. In both cases, continual improvement is not a prominent part. To say that TQM (or a Quality Management System) is not part of lean is partially correct. Actually, lean is a subset of quality. So any lean tool is a TQM (or QMS) system.” (For more on TQM, visit the Total Quality Management website at managementhelp.org/quality/total-quality-management.htm)
“TQM is as important as lean in our opinion,” says Oskin. “Lean is about eliminating waste, and quality can represent a significant amount of waste and cost. These are all tools in the broader context of continuous improvement.”
“I see TQM as part of lean,” says Aptean’s Thomas. “You have to combine a number of approaches. Lean without TQM is difficult, since you aren’t addressing all aspects of production. As I mentioned [earlier], you can run the floor at 90 percent efficiency, but without total quality, you may have to repeat your efforts to yield a quality product. You have to balance both.”
“While we may think of TQM as independent of lean manufacturing, they are actually very intertwined,” says Infor’s Edgett. “Most companies would consider process improvements a part of TQM as well as lean manufacturing. Therefore, all process improvement initiatives focused on quality will impact lean manufacturing initiatives and vice versa.”
While this article has focused primarily on lean manufacturing and TQM as methods to set benchmarks to improve manufacturing processes, there are others that can be employed, including Six Sigma, Theory of Constraints, etc. For more information, check the references list.
Manufacturing benchmark metrics based on SQDCM
The following metrics are suggestions from MMTC for how to measure each of the SQDCM (safety, quality, delivery, cost and morale) components to gauge a processor’s performance. These metrics are more meaningful when they are tied to performance goals that roll up to an overall strategic plan.
Safety—Employee:
- Number of lost hour injuries incurred by area and in total
- Number of lost hours due to injury by area and in total
- Number of near-miss incidents reported by area. Near misses are not bad—if there are no near-miss incidents reported, then people are not looking hard enough. These should be rewarded, and a goal of finding them monthly should be established (i.e., a goal of zero near misses is bad)
Safety—Food:
- Number of deviations discovered during standard work audits by area (variation is the enemy)
- Number of near-miss incidents reported by area. Near misses are not bad—if there are no near-miss incidents reported, then people are not looking hard enough. These should be rewarded, and a goal of finding them should be established (i.e., a goal of zero near misses is bad)
- Number of deviations discovered during 5S audits by type, by area
- Number of deviations discovered during GMP audits by type, by area
Quality:
- Number of customer complaints (by type if possible)
- Number, pounds, gallons of defects/rejects/scrap (by type if possible)
Delivery:
- Number and percentage of late shipments (by product type if possible)
Cost:
- Day by hour production charts (actual vs. plan by hour)
- Dollar and percentage reductions in cost by area
- Dollars spent on overtime by department
- Dollars spent on rework by department
Morale:
- Number of employee suggestions acted upon
- Employee engagement scores
- Number and percentage of employees trained in lean principles
- Number and percentage of employees exposed to kaizen
For more information:
John Spillson, MMTC, 734-451-4232,
jspillson@mmtc.org, www.mmtc.org
Rob Stauffer, MMTC, 734-451-4296,
rstauffer@mmtc.org, www.mmtc.org
Mike Edgett, Infor, 800-260-2640,
mike.edgett@infor.com, www.infor.com
Roy Thomas, Aptean, 770-351-9600,
roy.thomas@aptean.com, www.aptean.com
John Oskin, Sage Clarity, 800-809-3042,
john.oskin@sageclarity.com, www.sageclarity.com
Khris Kammer, Rockwell Automation, 440-646-3434,
kkammer@ra.rockwell.com, www.rockwellautomation.com
Todd Allsup, Stellar, 904-260-2900,
tallsup@stellar.net, http://stellar.net
David Bradley, MMTC, 734-451-4210,
dbradley@mmtc.org, www.mmtc.org
Adrian Pask, Vorne, 630-875-3600,
adrian.pask@vorne.com, www.vorne.com
Resources:
“The Five Fundamental Jigsaw Pieces for Successful Lean Implementation,”
Dr. Gunter Beitinger, Siemens AG, Guadalajara.
“A Study on Total Quality Management and Lean Manufacturing: Through Lean Thinking Approach,” Alireza Anvari, Yusof Ismail and Seyed Mohammad Hossein Hojjati, World Applied Sciences Journal; 12 (9): 1585-1596, 2011; ISSN 1818-4952; http://idosi.org/wasj/wasj12(9)/34.pdf.
“Kaizen Training and Research Page” - CSS Research and Training Center, Creative Safety Supply, LLC, https://www.creativesafetysupply.com/articles/kaizen/.
“World-Class OEE,” Vorne, www.oee.com/world-class-oee.html.
“Study reveals attributes of top organizations,” FE, Manufacturing News, March 2016, http://tinyurl.com/h3ospse.
“Manufacturing Performance Benchmark Study for Fast Moving Consumer Goods,” Sage Clarity, http://sageclarity.com.
“Got waste? Check, analyze, plan, do!” Craig Andrews, ConAgra Foods Inc., FE, May 2016, http://tinyurl.com/j53rneg.
“What is Six Sigma?” ASQ, http://tinyurl.com/lnqkkxm.
“Lean Manufacturing and the Food Industry,” Brian Heymans, Continuous Systems Improvement, CourseHero Web site.
Looking for a reprint of this article?
From high-res PDFs to custom plaques, order your copy today!