Processing Technology
Analytical Instrumentation: When Exacting Information is Needed
Whether it’s maintaining quality or proving authenticity, precise measurements provide the data to make informed decisions.

Photo courtesy of Getty Images / Microgen
Beyond the normal process measurements (e.g., flow level, pressure, pH, temperature, conductivity, etc.) needed to check that production is on track, analytical instrumentation can track important variables that can keep difficult-to-control processes—e.g., fermentation—on track, in addition to monitoring fat contents in meats and proving authenticity of the ingredients you purchase, for example, virgin olive oil or seafood. Last year, we reviewed current state-of-the-art in instrumentation. In this article, we look at some practical applications.
Keeping Brewers’ Yeast of Consistent Quality
Making brewers’ yeast for commercial beer production and home brewers is an exacting process and requires more than its share of instrumentation—from pH and density to PCR (polymerase chain reaction) and UV-Vis (ultraviolet-visible) spectrophotometers. Omega Yeast, founded in 2013, creates dozens of yeast strains for just about any brew type you can imagine. The company provides reliable, made-to-order yeast and bacterial pitches for brewers around the world.
To perform quality analyses of its cultures, the company uses a range of procedures, including microbiological growth/plating, cell counting with a hemocytometer, cell mass by percent solids, PCR for potential spoilage organisms, pH and apparent extract. The in-house lab also measures apparent extract, FAN (free amino nitrogen) and BUs (bitterness units) in its batches of propagation medium (i.e., wort).
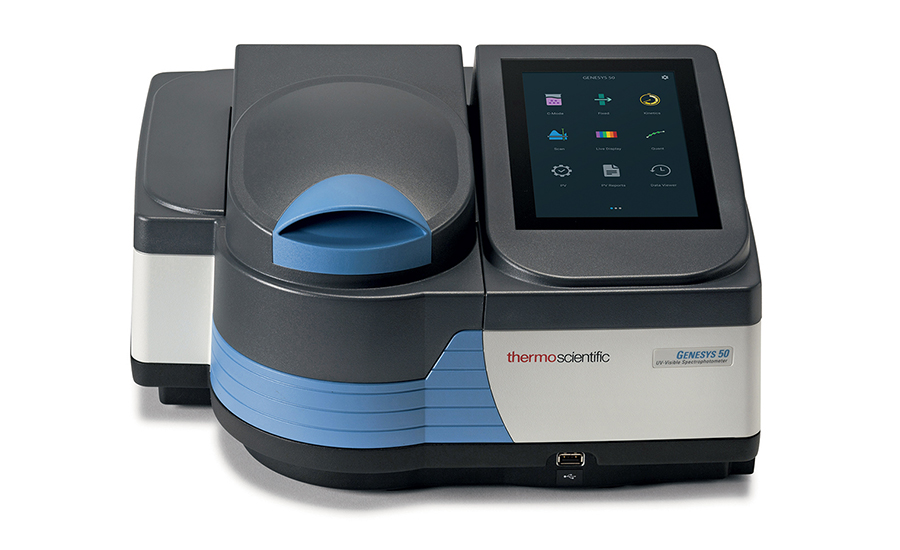
Equipment used in the QA lab includes density and pH meters, microscope, centrifuge, PCR thermocycler and Thermo Fisher Scientific’s GENESYS UV-Vis spectrophotometer.
“Our R&D department utilizes the GENESYS UV-Vis spectrophotometer for OD600 measurements corresponding to cell number, FAN, BUs and ferulic acid conversion by POF+ yeast,” says Laura Burns, director of research and development. “We have designed a few in-house assays: for example, measurements of dextrin metabolism with iodine as a starch indicator and measurements of cell growth/survival by the acidification of medium using bromocresol blue pH indicator. We have also used our GENESYS UV-Vis Spectrophotometer for the analysis of water/minerals that would traditionally use a colorimeter.
“With in-house testing, we can employ rigorous monitoring of every brew and every culture we produce,” adds Burns. “With bulk throughput and continuous sampling, we can identify outliers and reject anything that is out of our specifications. Third-party analysis is often more expensive, and results are not relayed fast enough to integrate into our quality program.” Outside labs are reserved for methods too specialized for the scope of Omega’s quality lab.
Why use UV-Vis spectrometry versus other analytical instrumentation techniques? “Other techniques are often complimentary,” says Burns. “The UV-Vis has been versatile and allowed us to get the most bang for our buck from our quality lab to our R&D projects.”
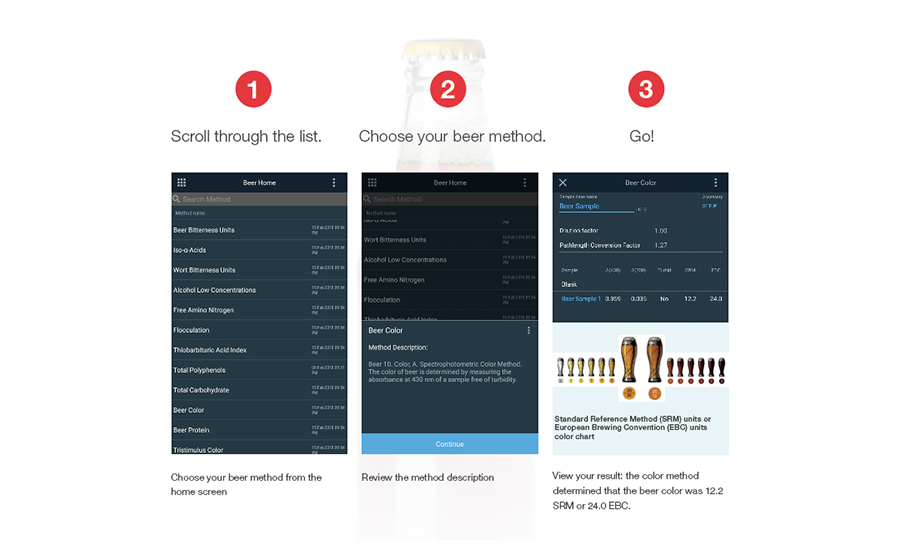
When combined with the GENESYS spectrophotometer, Thermo Fisher Scientific’s BeerCraft software performs an integral role in developing new yeast strains. “We find that we rely heavily on colorimetric assays as affordable screening tools for research,” says Burns. “The [spectrophotometer] has helped us study topics such as hop creep, diastatic yeast, wild yeast metabolites, yeast contributions to haze, nutritional requirements of yeast.”
Smoke Gets in Your Wine
Just like the song, “Smoke Gets in Your Eyes,” no one wants smoke derivatives in their eyes or wine, and while this may not be a problem in many areas where grapes are grown, wildfires near wine-grape growing regions like California can mean that wine could be tainted if the grapes have been exposed to smoke.
An application note, “Quantitation of Smoke Taint Markers in Wine using the Triple Quad LCMS-8050,” from Shimadzu reports that guaiacol rutinoside and 4-methylguaiacol rutinoside are smoke taint markers that are found in grapes and wine that have been exposed to smoke from forest fires. In a test, researchers sampled and analyzed four different white and red wine samples for the two smoke taint markers. A triple quad, liquid chromatograph mass spectrometer (Shimadzu LCMS-8050) was used to perform the test.
When grapes are exposed to smoke in a vineyard due to a nearby forest fire, volatile phenols like guaiacol rutinoside and 4-methylguaiacol rutinoside can permeate the grape skin, bond with the sugars (glycosylation) and accumulate inside the grapes. Due to their reduced volatility, the resulting glycosides can no longer be detected by smelling or tasting the grapes. However, fermentation breaks down those bonds again, and the related compounds often give the wine a burnt or “ash tray” flavor. Since tasting or smelling the grapes can’t detect whether the grapes have been damaged, testing the grapes before fermentation can prevent wasting time on a batch that can’t be sold.
Two white and two red wine samples were filtered through a 0.45 micro-meter PTFE filter. No dilutions were made prior to injection into the LCMS for analysis. An LC-40 Nexera HPLC system was coupled to the LCMS-8050 mass spectrometer with an ESI source. A 15-minute chromatographic method was developed to quantify 4-methylguaiacol rutinoside (464.2>147.1) and guaiacol rutinoside (450.2>147.0) by MRM (multiple reaction monitoring), which allows the detection and quantification of specific molecules in a complex mixture. Additional LC and MS parameters were used in the analysis. The figure below shows chromatograms of each analyte in unspiked and 10 ng/ml spiked white wine.
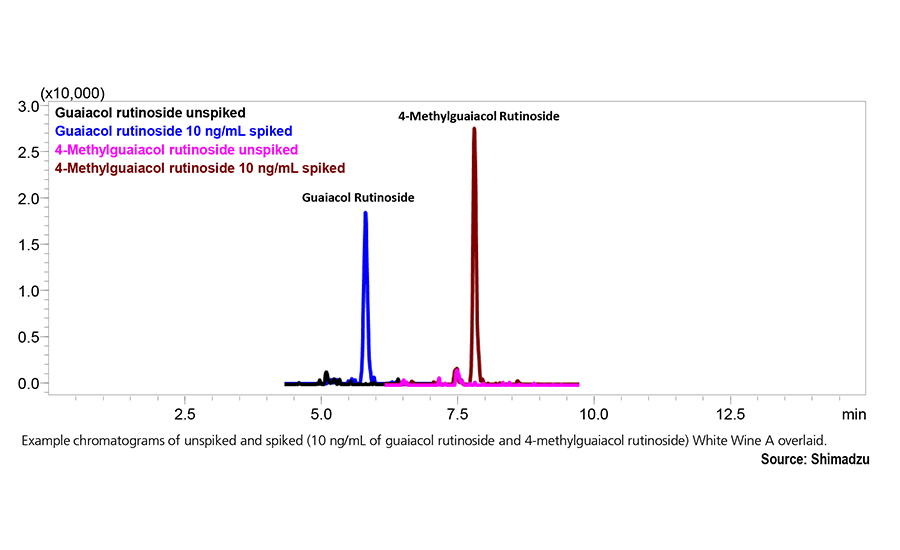
Standard additional calibration curves were generated in representative white and red wine samples to quantify native guaiacol rutinoside and 4-methyl guaiacol rutinoside concentrations. After developing calibration curves, concentrations of smoke taint markers were determined with a linearity higher than 0.999 for all calibration curves, and accuracy was between 80%-120% for each calibrator. Thus, residuals of the two smoke phenols in grapes can be detected accurately, typically ranging in concentrations from about 0.5 ng/ml to more than 100 ng/ml. For example, of the wines tested, 4-methylguaiacol rutinoside concentrations ranged from less than 0.2 ng/ml to 6.1 ng/ml, and guaiacol rutinoside from about less than 0.5 ng/ml to about 13 ng/ml.
When Provenance is Crucial
When you say you sourced your ingredients directly from a specific trusted fishery that’s known for its high quality and food safety, it’s a relatively safe bet that you’re getting what you ordered. But if you’re going through one or more distributors, can you trust those in the supply chain who say the seafood you ordered is the real thing? You need to test for authenticity. But you may not face this type of problem often enough to maintain your own lab analysis equipment and personnel to operate it, so that’s why labs like Source Certain exist.
Source Certain, located in Perth, and serving the Australian market, specializes in food authenticity testing; lab also performs beverage and minerals testing. Source Certain uses elemental fingerprints to confirm the geographic origin of products. According to Cameron Scadding, CEO, his company provides a scientific solution that verifies the origin of products for food and beverage companies.
“Product origin and production claims, like sustainable and ethical sourcing, are vital information to consumers these days,” says Scadding. “It’s not just the product that matters anymore but also the promise. These promises are becoming as important, in some situations more important, than price and other product features.
“Our customers come to us to help them support their product promises. We provide much more than just the analytical testing component. From supply chain mapping, database building, routine in-market sampling and crafting stakeholder communications, our provenance science service offers an end-to-end solution for clients,” says Scadding.
Typically, the lab measures all elements in every sample. This generates a lot of data, so good data management is critical. “We also need high integrity results that will stand up in a court of law,” says Scadding. And his company has provided expert witness testimony in court cases.
When Scadding’s lab receives a new sample, it’s typically added to the end of an Agilent ICP-OES (inductively coupled plasma optical emission spectrometer) batch to provide a list of the elements in the sample and their concentrations. “Alternatively, we’ll use our laser ablation ICP-MS (inductively coupled plasma mass spectrometer) system to provide that information,” says Scadding.
"Standardizing the fat content also standardizes the drying phase. We can save weight loss and we can reduce the ripening phase."
— Rudy Magnani, plant manager, Clai
Consistent Fat Content in Pork Shortens Sausage Production Time
Without a consistent fat content in pork, the required time to dry sausage is a hit-and-miss affair with a lot of guesswork. To solve this problem of varying content in the pork used to make sausage, the Clai cooperative in Bologna, Italy decided to try a FOSS Analytical MeatMaster X-ray analyzer to standardize fat content in its dried sausage products for consistent quality and a more predictable, cost-effective drying process.
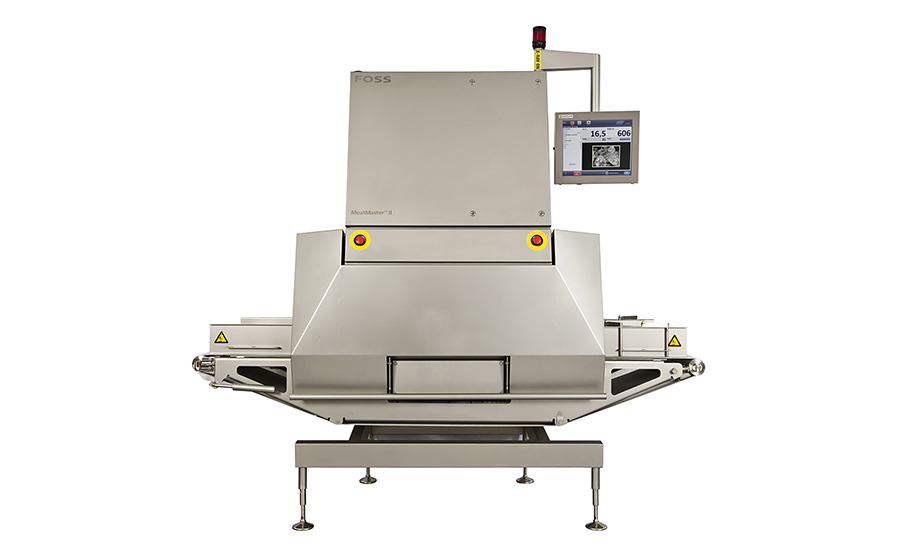
“Standardizing the fat content also standardizes the drying phase. We can save weight loss and we can reduce the ripening phase,” says Rudy Magnani, plant manager, Clai.
The Clai cooperative has a slaughterhouse and a plant where it produces salami and sausages. The co-op has another plant in Parma and an energy plant where it produces energy and hot water from the waste of all the points of the swine production chain, says Magnani. “[By] organizing the drying phase, I can ensure that a product will be ready in the time I want. With fat content that is not standardized, the ripening time can change. In this way, we are able to ensure that the product will be ready at the right time, and that we can reduce the weight loss. That means more money earned for us,” adds Magnani.
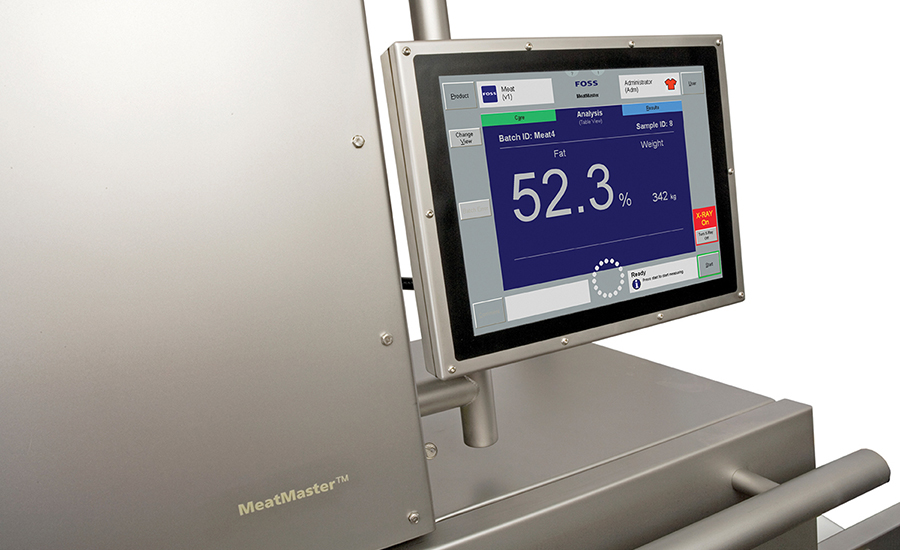
The co-op looked for technology that could keep track of the fat content in meat and some years back, had purchased a FOSS FoodScan, which was convenient to check the fat content of each batch of meat after it was produced. Magnani realized that if he could monitor the fat content of meat in production, he could always have the right level at the end of the production line and before the drying step. “We decided to buy MeatMaster to control the fat content online. In this way, we can first of all ensure our customers that we have fat standardization and ripening standardization, because the fat standardization is very important for the ripening phase.
“First of all, we weigh the meat, we control the fat content of the meat and ensure the absence of foreign objects,” adds Magnani. “Then we grind the meat with the cutter. We make the first cut with the cutter and then with the grinder. When the meat is ground and minced, it goes in a mixing machine, and after that a filling machine fills the casing, the product.”
After the filling phase, the meat goes into a drying phase for one week, in which fermentation occurs. After fermentation, the product moves to a cutting room where it remains at high humidity and low temperature until the end of the ripening process. The ripening phase spans from two weeks to four months, depending on the shape of the product, fat content and desired quality.
“By standardizing the fat content, and also the drying phase, we can save weight loss and we can reduce the ripening time,” says Magnani.
Looking for a reprint of this article?
From high-res PDFs to custom plaques, order your copy today!