Improving OEE
Finding new AI-based methods to boost productivity requires digital data
Large gains in productivity have been made over the years using lean manufacturing and Six Sigma, but today new technologies can further efficiency improvements
The manufacturing industry in general has seen major improvements in productivity using traditional methods like Six Sigma and lean manufacturing. While it might seem that we have gleaned all the improvements that are possible using these methods, today’s sensors and software make it possible to turn even a fraction of a percent of overall equipment effectiveness (OEE)—if that’s the KPI you’d like to use—into a worthwhile savings, enough to justify the cost of sensors and new software techniques.
I recently spoke with John Merrells, chief product officer, Sight Machine, to get an idea of what’s possible with the new tools we have today. Merrels leads development of the company's AI-based manufacturing data platform and its industry solutions. He has had roles in many start-ups in Silicon Valley from software engineer and architect to CEO, CTO, founder and co-founder.
FE: Against the backdrop of decades-old practices like lean manufacturing and Six Sigma, what opportunities does the digital era provide for continuous improvement?
John Merrells: Those methodologies helped boost productivity from the 1970s through the early 2000s, but the potential gains have largely been achieved. U.S. manufacturing sector productivity declined by an average of 0.3% annually from 2004 to 2016 after growing 2% per year from 1992 to 2004.
Methodologies like lean manufacturing and Six Sigma have typically focused on individual machines or processes, relying on snapshots of historical data. But modern production processes run through many connected machines, and each of those machines today likely has dozens or hundreds of sensors. The unlocking of value comes from expanding the view from a single asset to the entire system.
Unless you know more about what’s happening with your production lines, it’s very hard to continuously improve them. We’ve reached the limit of what people can sense with their own eyes and ears to fix. Once you move beyond 10 variables, you move beyond the ability of an engineer to understand the system, especially when looking at streaming data. When you move to 10,000 variables, you need cloud computing and machine learning.
The software capable of modeling these complex production processes, correlations and interactions and analyzing the data in real time has only recently become available. For example, innovations in the automation and AI space play a significant role here.
FE: Has something about the nature of manufacturing also changed that requires a change in continuous improvement methodologies?
Merrells: Twenty or thirty or fifty years ago, a manufacturer worked very hard to optimize a static process. They would get everything working right, and then run the line for several months straight without changing anything.
Today you may have a lot size of one unit, with product customization driving continuous changes in production. You also have extended supply chains that require more insight both upstream and downstream of the plant floor. The old way of relying on some very smart engineers and operators to set up your plant isn’t going to work. You have to be able to understand your processes far more deeply, and your line changeover has to be very efficient.
FE: Is the technology for digital continuous improvement general enough to work across multiple industries and types of processes, or does it need to be developed differently for each application?
Merrells: Although the core technologies are the same across industries, achieving continuous improvement centers on the processes and equipment specific to each industry. You can’t just dump all your data into a data lake, run some general-purpose analytics on it and expect to get useful results. As we’ve worked with clients in many different industries, we’ve built a body of software tools and in-house expertise that help clients in those industries achieve results more quickly.
The common core technologies for Sight Machine, which we’ve been building and enhancing for eight years, are data connectivity (the ability to collect data from all the sources and in all the formats used in plant-floor and manufacturing-management settings); our data pipeline (cleaning and normalizing that data); and data modeling (modeling the data to correspond with individual machines, production steps, batches or parts). These core technologies comprise Sight Machine’s Manufacturing Data Platform.
Sight Machine takes a data-first rather than workflow-based strategy. The platform ingests all the available data and models the production process. The modeled data, continuously updated with new streaming data, is then the single source of truth against which all analytics are applied. This contrasts with the traditional application-first model of development, which builds a system for a specific workflow, but is difficult to scale or adapt to other use cases.
To continuously improve manufacturing through data analytics, you need three types of analytics. Not just descriptive analytics, which tell you what is going on or what happened in the past, but also predictive analytics to warn of likely quality or performance issues in the future, and prescriptive analytics to recommend corrective action. Most of the time, the analytics needed for more advanced predictive and prescriptive analytics must be adapted to the specific machines and process of different types of manufacturing. While Sight Machine has worked with clients in 15 industries, our first three industry-specific solutions, which we recently released, are for paper & tissue, packaging, and chemicals, including food chemistry.
We don’t take data from just one machine, we take it from the entire process area. That can include an entire line of machines, or multiple factories as a product passes through the states of production. In addition to the real-time streaming sensor data, we pull in all relevant other types of the manufacturing-related data and documents including from ERP, MES, MLP and quality control systems. The key thing we do is a system-wide view of the entire line.
We do this with real-time streaming data, so you’re not looking at a one-time or periodic historical snapshot of conditions. A real-time view of conditions is necessary if you want to be able to take corrective action on batches or parts that are currently being manufactured.
FE: Are you able to quantify the amount of improvement achievable through this approach?
Merrells: We regularly see a 5% to 10% lift in OEE (Overall Equipment Effectiveness) when we successfully engage with a company. Management experts have found that a 1% improvement in OEE generates 3% to 4% of earnings improvement, as added output translates into increased revenue and reduced unit cost. It’s an enormous lever for these big manufacturers.
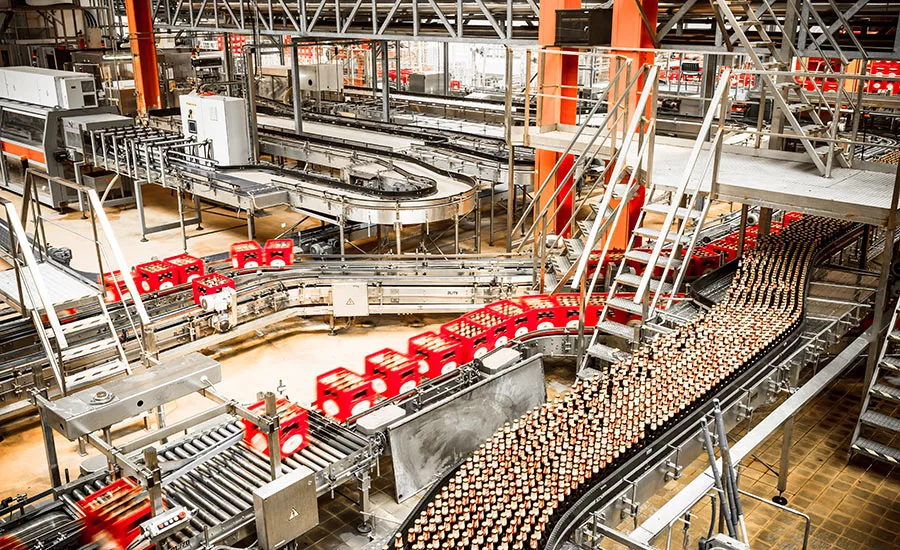
Let’s say you’re an aluminum can manufacturer. You make 1 million cans a day. When you raise OEE by 10%, now you’re making 1.1 million cans a day. You’re paying the same for equipment and labor, the only additional cost you have is more aluminum. When you make more stuff for very little incremental cost, you drive the effective unit cost down for every unit you make.
FE: What’s an example of how you applied artificial intelligence techniques to improve productivity in a food or beverage plant?
Merrells: One client is a well-known European beer company dealing with an alarm problem in one of its biggest bottling plants. There were so many different alarms going off so frequently that it was very difficult to determine which ones required action. While the alarms could indicate the root cause of a problem, more often they were downstream cascades, minor warnings, or even false alarms.
Think of a neighbor’s car alarm that goes off all the time—after a while, you start to ignore it, and pretty soon you won’t know to respond when someone is actually trying to steal the car. This beer maker needed to filter out alarm noise in order to identify the root causes of downtime and proceed to address them, rather than having its technicians chasing secondary effects and noise.
Sight Machine applied a pair of AI algorithms to the company’s alarm data, using a three-step approach. First, we performed hierarchical cluster analysis to create groups of alarms representing various categories of problems. The next stage involved getting rid of alarms that were completely inconsequential in each group. We did this by applying alarm weights based on techniques commonly used in natural language processing. If an alarm appeared frequently it was probably important, but if it occurred in many clusters, it probably wasn’t. This is the same approach employed to filter documents where words like “a,” “an,” and “the” appear so frequently that they aren’t useful for classification.
Once we had clusters of alarms, each filtered down to only the most important ones, we could perform a sequence analysis. This enabled us to identify the clusters that tended to appear first, revealing the root causes of downtime events.
Another packaging client had a high-speed line producing about a million units a day, with very sophisticated engineers and a lot of data. Our software modeled the line and analyzed its performance, and resolved a bottleneck they hadn’t understood before. It turned out that to meet quality metrics of the number of defects per hour, operators at one part of the line had slowed the machine down, which reduced the defects. But in doing that they slowed the whole line down and killed their OEE. Attacking that issue in a number of days led to a 4% improvement in OEE.
FE: What’s the connection between continuous improvement and sustainability?
Merrells: The connection is direct. Manufacturers today are increasingly committed to reducing their environmental impact to create a more sustainable future. Energy is one of the largest costs of production in many industries. Reducing energy usage—or producing more with the same level of consumption—has a double benefit of improving profits and reducing carbon pollution.
There are multiple pathways to reducing energy usage. While one way is to operate furnaces more efficiently, another way is to reduce defects and scrap. With a large sheet glass manufacturer we work with, it takes three days between loading the raw material—mostly sand—into the furnace until glass is completed, including melting sand and baking out impurities from molten glass, which uses a tremendous amount of energy. Finished glass sheets that fail quality inspection must be remelted and re-manufactured. By being able to identify problems while the glass is still in molten form, early on in a process, the client is now able to take corrective action to avoid defects and thus avoid the energy and other costs of remelting and re-manufacturing defective output.
For more information, visit Sight Machine for food and beverage on line at https://sightmachine.com/industries/food-and-beverage.
 About John Merrells
As chief product officer at Sight Machine, John leads development of the company's manufacturing data platform and its industry solutions. John has had roles in many start-ups in Silicon Valley from software engineer and architect to CEO, CTO, Founder and co-founder. He has also been an advisor and mentor to many enterprise start-ups and social entrepreneurs through StartX, a community of serial entrepreneurs, industry experts, tenured Stanford professors, and well-funded growth-stage startups. John holds a BS degree in Computer Science from the University of Hertfordshire.
Looking for a reprint of this article?
From high-res PDFs to custom plaques, order your copy today!


-WAT106---Digital-data-recording-prevents-tampering-and-improves-food-safety-compliance.webp?height=200&t=1704912941&width=200 "Food on a conveyor")
