Engineering R&D
How to make sense of big data in food processing
Data sitting in storage can’t unlock its secrets to your success without using the right tools.
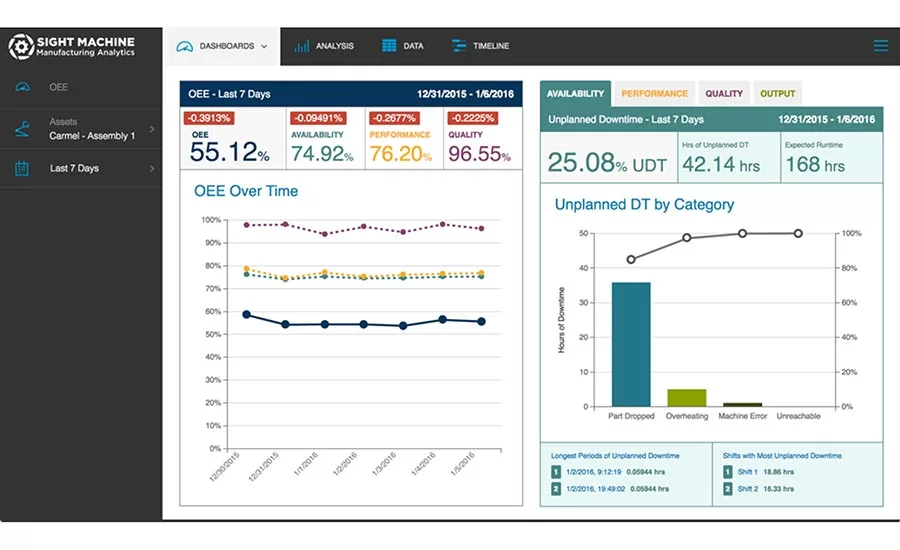
Sight Machine provides real-time OEE dashboards using an artificial intelligence engine that acts on wide and diverse data inputs from several systems from plant floor and quality to ERP. Source: Sight Machine.

You have a modern yogurt plant with thousands of sensors and control points, in fact, rivaling any modern chemical facility or refinery. Or you’ve upgraded your bakery, and there are new sensor points everywhere, and from these devices, you’re collecting data you never had before. Now, what are you going to do with all the data you’re collecting? How do you make sense of it?
Over the years, there have been many software solutions developed to tackle this problem. Some approach it from the quality (SPC/SQC) level; some approach it from the shop floor HMI/data historian/MES layer, and some from the ERP level. Then, too, OEE software promises to find problems in your lines. Problem is, in many cases, these systems each provide a partial view into the goings-on in your facility. What if you could analyze all the data from all sources and find solutions to your production problems, quality and waste issues, OEE and more?
Nate Oostendorp, a cofounder and chief technical officer of Sight Machine, thought there had to be a better way to glean manufacturing solutions from a mountain of collected data. Why not use the big data methods the Amazons and Googles of the world use? Look for patterns and apply methods, algorithms and procedures to extrapolate intelligent, actionable information.
Six years or more in development, Sight Machine, an analytics platform, is finding use in aerospace, automotive, CPG, oil and gas, pharma and other high-level applications. So, why not apply it to food and beverage? Certainly, our industry has the same challenges and more—like short ingredient/product life and regulations such as FSMA to make the challenge greater. Below, Oostendorp talks about this new twist to manufacturing analytics.
FE: How long has Sight Machine been in development? Who are the major developers?
Nate Oostendorp: Sight Machine was founded in 2011. I had previously helped build the open source community and developed community software, as a cofounder of Slashdot and an architect at SourceForge.net, and had also worked in industrial controls. My cofounder, Kurt DeMaagd, was a professor of information at Michigan State. Both of us had worked in automotive plants early in our careers. We saw an opportunity to bring some of the big data technologies developed for the Internet and apply them to the incredibly disparate types of data generated by manufacturing.
FE: What were the goals for this software? After all, there are many systems that promise intelligent analytical solutions to manufacturing problems.
Oostendorp: Our goal is to help manufacturers get new insights from their data to improve quality and productivity, and give them real visibility into the production process. We say that manufacturing is DRIP—Data Rich, Information Poor. Data from machines and manufacturing processes tends to be isolated in different places, in a wide variety of formats and time series/speeds—and generated in huge quantities. A classic data historian may be able to archive or visualize machine telemetry, a quality database may be able to store measurements, but to explore all of the interplay of parts and processes, you need a big data solution that can turn that data into usable information in real time.
FE: How does Sight Machine work, and how is it different from other data analytics tools?
Oostendorp: We believe we’re the only company to offer an end-to-end solution for turning a broad range of factory data into usable insights on productivity and quality, with technology that can be applied to any type of discrete or process manufacturing.
Much of the commercial focus around the Industrial Internet of Things has been on collecting data or building technology platforms, with an assumption that once you’ve got the data in one place, anyone can derive tremendous insights from it. But we’ve found the real challenge comes after you’ve collected it—blending and contextualizing the data, modeling the factory as a digital twin and analyzing the data in a repeatable way.
We start by collecting the data, either directly from the automation or from a historian, or from MES, ERP, QS or other systems of record. We have a patented technology, our AI Data Pipeline, that uses artificial intelligence to prepare the data for analysis, including refining and cleaning the data, blending and joining it, and contextualizing it. This combines all the disparate streams of data in a way that can be associated directly to the production process, a “digital twin” of both specific steps in production and of individual product batches.
We then apply a broad range of analytical tools to identify the events, trends or correlations that determine why, for example, one machine is less productive than an identical machine. And we provide visualization tools to display the results in ways that support best practices for different functions—like machine operator, plant manager, executive manager.
FE: What inputs can Sight Machine handle (e.g., sensors, PLCs, quality systems, etc.)? Are there any limits to data types?
Oostendorp: We handle any type of digital data used by manufacturers—from sensors and PLCs, historians, ERP and MES systems, cameras, meters, operator entered data—you name it.
FE: Your literature talks about a “Plant Digital Twin.” What is that?
Oostendorp: A Plant Digital Twin is a mirror of a plant’s lines, machines, processes and parts. We’re modeling the manufacturing process from beginning to end. We need to understand the entire process and the interactions among materials, conditions, machine configurations, everything that can affect the final product.
FE: What are some of the areas in which your real-time data analytics can assist manufacturers with problems?
Oostendorp: Quality, productivity and visibility into operations. We answer questions like:
- Why has machine downtime risen 14 percent this month?
- Why is our line in Factory A 21 percent less productive than an identical line in Factory B?
- Why has our OEE decreased?
- Which production step is responsible for this defect?
- Why is my scrap cost running 10 percent higher this month?
Answering these questions lets companies increase output and reduce scrap, which have a direct impact on profitability. We have also developed an analytical framework, the Manufacturing Performance Index, to help identify which projects are expected to deliver the highest financial returns, as well as a Digital Readiness Index to gauge the technical and operational readiness of a manufacturer for digital transformation.
FE: Who are the likely users in a facility or enterprise?
Oostendorp: The platform can be used at different levels by different people inside an enterprise:
- Operators may use local dashboards to understand the performance of machines in real time.
- Plant managers may use dashboards of overall performance of a plant or different lines.
- Quality technicians and plant engineers may use the tool to troubleshoot problems or to improve the launch curve for deploying new automation.
- At a corporate level, the manufacturing performance data may be integrated into a larger BI reporting framework.
- Data scientists within the company may export the data from the platform to use in their own analysis, combining the production data with other information they want to analyze.
FE: How can these tools help specifically with food and beverage? You have pharma applications, so there must be come carryover, right?
Oostendorp: Food and beverage makers face the same basic challenges as other manufacturers: maintaining quality, increasing productivity, gaining visibility into the production process. We’re currently working with clients (in other industries), and many of these applications have very similar properties, in terms of scale and speed, as food manufacturing and packaging.
For more information, visit www.sightmachine.com.
Looking for a reprint of this article?
From high-res PDFs to custom plaques, order your copy today!