Before the Recall: How Spectroscopy Can Help Food Producers Find Problems Faster
The recent Cyclospora outbreak highlights how VIS-NIR, Raman/SERS, chemometrics and machine learning are being investigated for faster food-safety screening.
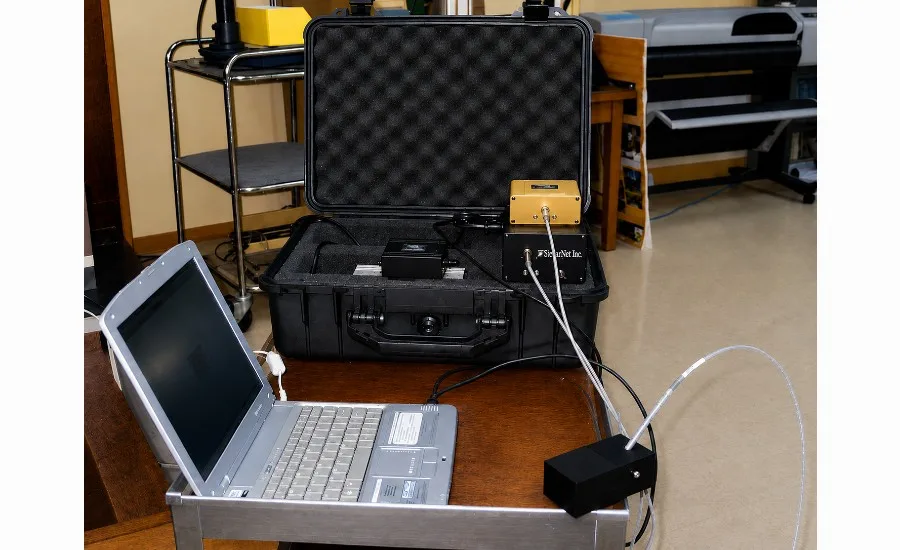
Components of the portable visible/near-infrared spectroscopic system: battery, light source, spectrometer, fiber-optic assembly, probe holder and computer.
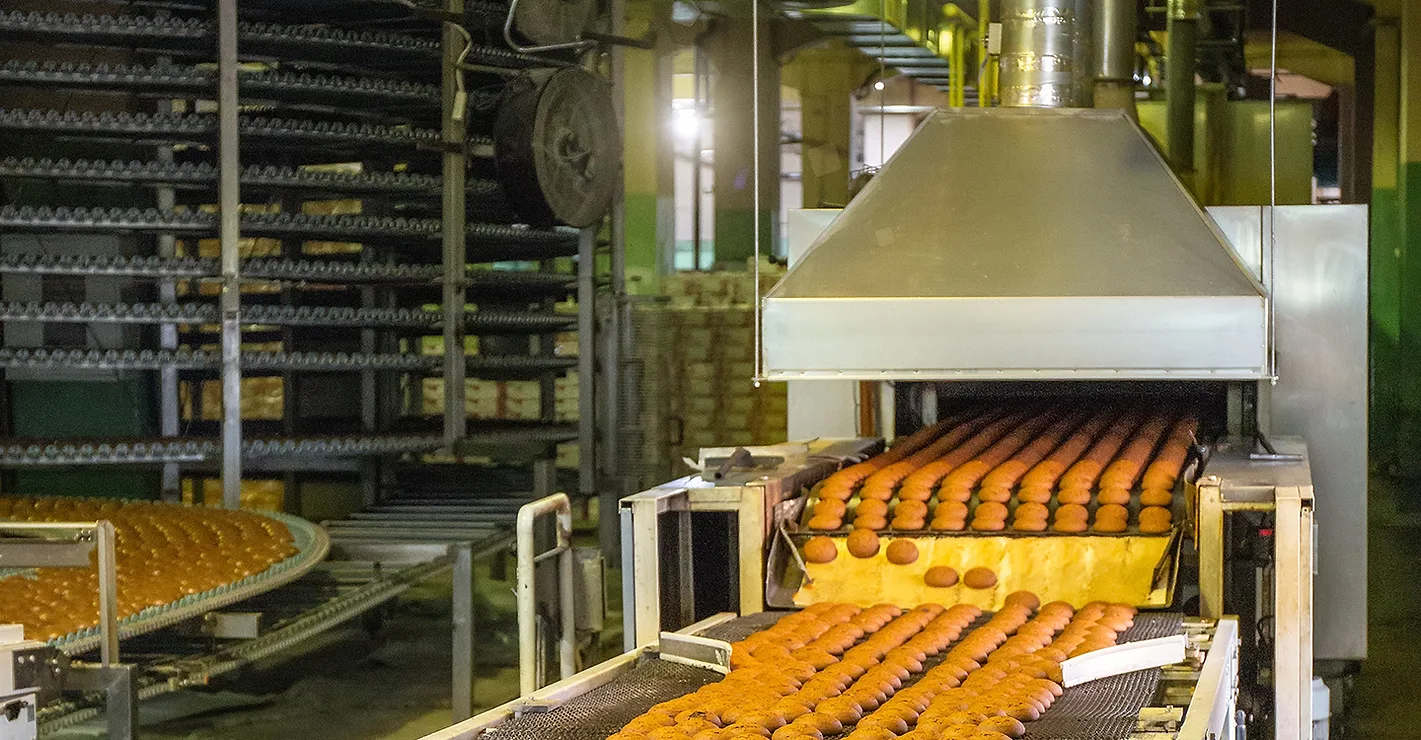
What if a food processing line could help identify a potential contamination problem before a laboratory result arrived? Imagine a compact optical sensor positioned above a conveyor, periodically measuring produce as it moves through production, or a handheld or fixed sensor examining stainless steel food-contact surfaces between shifts. Rather than attempting to replace microbiological testing, the system continuously asks a simpler question: Does what I am measuring look normal?
A spectral change would not necessarily mean Salmonella, Listeria, E. coli or another pathogen is present. But it could provide an early warning that a product or surface deserves immediate attention and confirmatory testing. That capability is not yet routine food plant technology, but recent spectroscopy research suggests it may not be as far away as it sounds.
The 2026 Cyclospora outbreak associated with iceberg lettuce provides a timely example of why faster screening matters. Confirming Cyclospora cayetanensis requires validated molecular methods such as PCR; conventional spectroscopy is not a replacement. But developments in VIS-NIR, Raman/SERS, chemometrics and machine learning are beginning to show how optical measurements could provide an additional screening layer between visual inspection and definitive laboratory testing.
Using Light to Screen for Contamination
In a visible or near-infrared reflectance measurement, broadband white and NIR light illuminates the food or processing surface. Water, pigments, proteins, fats and other constituents absorb and reflect different portions of that light. Collection optics capture the reflected light and direct it, often through an optical fiber, to the spectrometer. Chemometrics and machine learning can then evaluate relationships across hundreds of wavelengths rather than relying on a single spectral feature. For food safety, that can support a practical first question: Does this sample or surface look sufficiently different from normal to warrant further investigation?
USDA Research Shows Advances in NIR Food-Safety Screening
USDA Agricultural Research Service researchers previously demonstrated contamination screening inside a commercial poultry processing plant using portable StellarNet spectroscopy systems. Broadband light illuminated processing-equipment surfaces, reflected light was collected through fiber-optic probes, and StellarNet BLACK-Comet-CXR visible and DWARF-Star InGaAs NIR spectrometers measured fecal contamination, ingesta contamination and clean stainless steel and rubber conveyor surfaces.
A visible wavelength ratio correctly classified 100% of contaminant samples and 92.5% of equipment surfaces; an NIR ratio correctly classified 100% of contaminant samples and 95% of equipment surfaces. The instruments were not identifying a specific pathogen. They were recognizing optical signatures associated with contamination that could trigger sanitation action or microbiological testing.
A 2026 USDA-ARS study moved NIR closer to the microorganisms themselves. Researchers cultured and purified two strains each of Salmonella, E. coli O157:H7 and Listeria monocytogenes, dried the bacterial cells on filter paper, and measured diffuse-reflectance FT- NIR spectra from 1000 to 2400 nm. After comparing multiple preprocessing and machine-learning approaches, a Savitzky-Golay first derivative combined with a support vector machine achieved 95.3% overall classification accuracy. This is an important proof of concept, but also an important limitation. The experiment used purified, dehydrated cultures rather than pathogens hidden in lettuce or present on a working production line. The next challenge is translating that ability to distinguish bacterial signatures into realistic food matrices and food contact environments.
Raman and SERS Push Toward More Specific Pathogen Detection
Raman spectroscopy provides chemically specific molecular fingerprints, while surface-enhanced Raman spectroscopy, or SERS, amplifies normally weak Raman signals using engineered silver or gold nanostructures. Increasingly, researchers are combining SERS with antibodies, aptamers, magnetic enrichment and microfluidics so that sample preparation chemistry selectively captures or concentrates an organism before Raman measurement.
Some of that research has already moved into lettuce and other real food matrices. A University of Missouri optofluidic SERS system simultaneously detected E. coli O157:H7 and Salmonella in romaine lettuce and packaged salad. The workflow used a short enrichment step, selective separation and antibody-functionalized SERS nanotags, followed by Raman measurement in a flow-focusing microfluidic device. The researchers reported detection of 10 CFU per 200 grams of food after 15 minutes of enrichment, with approximately two hours total analysis time.
More recent research continues to narrow the gap between laboratory spectroscopy and actual foods. A 2025 microfluidic-SERS platform used E. coli-specific aptamers to guide in-situ formation of silver nanoparticles on bacterial cells and reported a 1.1 CFU/mL analytical detection limit, with 83-125% recovery in lettuce samples. In 2026, researchers reported a SERS sensor for Listeria monocytogenes with an approximately 1.89 CFU/mL detection limit and approximately 101% +/- 6.3% recovery in spiked cheese, lettuce and meat samples. Another 2026 study used immunomagnetic enrichment and droplet-shrinkage-assisted SERS, reaching 7 CFU/mL in real chicken-meat juice, with results consistent with conventional plate counting. These are sophisticated biosensor workflows, not simply Raman probes pointed at food. Their performance depends on bacterial recovery, selective capture, SERS chemistry, sample preparation and controlled optical measurement.
Where AI and Chemometrics Fit
The common thread across VIS-NIR and Raman is increasingly the combination of optical measurement with multivariate analysis. PCA can reveal clusters and outliers. Supervised classification can distinguish known sample classes. Machine-learning methods can identify spectral relationships that conventional single-wavelength approaches may miss. The 2026 USDA NIR study is a clear example. The spectral measurement contained the information, but the strongest pathogen-classification performance came from pairing appropriate spectral preprocessing with machine learning.
For a food plant, these technologies represent different levels of screening rather than a single replacement test. VIS-NIR may rapidly flag unusual composition or surface contamination. NIR combined with machine learning is now being investigated for direct bacterial classification under controlled conditions. Raman provides more chemically specific molecular fingerprints, while SERS combined with selective capture chemistry can push toward very low-level microorganism detection. None currently eliminates the need for microbiology, PCR or other validated confirmatory methods.
What If the Production Line Could See It Coming?
The individual pieces are beginning to come together. Optical spectroscopy has already been demonstrated on real food processing surfaces. NIR combined with machine learning has distinguished major foodborne pathogens under controlled conditions. Raman and SERS research has pushed pathogen-specific detection into lettuce, packaged salad, cheese and meat.
Consider a future processing line where a compact spectrometer continuously screens produce, while another optical sensor checks food-contact surfaces between production runs. An unusual spectrum would not have to identify a pathogen to be valuable. It might simply alert the plant that something does not look normal and trigger immediate inspection, sanitation or confirmatory testing.
Significant validation remains before such systems become routine food safety tools. But the objective is becoming increasingly realistic: not replacing the microbiology laboratory but giving the production team a reason to look sooner. A spectrometer watching a conveyor or checking a stainless steel surface between shifts may sound futuristic. The research suggests we may not be as far from that factory as we think.
References
1. Chao, K., Nou, X., Liu, Y., Kim, M.S., Chan, D.E., Yang, C.C., Patel, J.R., & Sharma, M. (2008). Detection of Fecal/Ingesta Contaminants on Poultry Processing Equipment Surfaces by Visible and Near-Infrared Reflectance Spectroscopy. Applied Engineering in Agriculture, 24(1), 49-55. DOI: 10.13031/2013.24148.
2. U.S. Food and Drug Administration. Investigation of Multistate Outbreak of Cyclospora Illnesses Linked to Iceberg Lettuce, 2026. FDA outbreak investigation
3. Ozturk, S., Huang, L., Hwang, C.-A., & Sheen, S. (2026). Classification and detection of Salmonella, Escherichia coli O157:H7, and Listeria monocytogenes using Fourier-transform near infrared spectroscopy coupled with machine learning. Food Research International, 229, 118485. DOI: 10.1016/j.foodres.2026.118485.
4. Asgari, S., et al. (2022). Duplex detection of foodborne pathogens using a SERS optofluidic sensor coupled with immunoassay. International Journal of Food Microbiology, 383, 109947. DOI: 10.1016/j.ijfoodmicro.2022.109947
5. Jayan, H., et al. (2025). Microfluidic-SERS research using E. coli-specific aptamers and in-situ silver nanoparticle formation for food analysis. DOI: 10.1016/j.foodchem.2025.142800
6. He, H., Liang, P., Lin, Y., et al. (2026). Rapid Raman Fingerprinting Identification of Listeria monocytogenes via Immunomagnetic Enrichment Coupled with Droplet-Shrinkage-Assisted SERS. Analytical Chemistry, 98(5), 3758-3771. DOI: 10.1021/acs.analchem.5c05756.
7. Cold atmospheric plasma-assisted deposition of SiOx-Ag nanocomposites for SERS-based detection of Listeria monocytogenes in complex food matrices. Sensors and Actuators B: Chemical, 457 (2026), 139663. DOI: 10.1016/j.snb.2026.139663.
AI tools were used to organize and summarize source material used in this article. Final reporting and verification were conducted by the editorial team.
Looking for a reprint of this article?
From high-res PDFs to custom plaques, order your copy today!