Cleaning and Sanitation: Organize and Record Your Data with the Right Tools
Tired of spending days to come up with a report when a governing body finds a food safety issue?
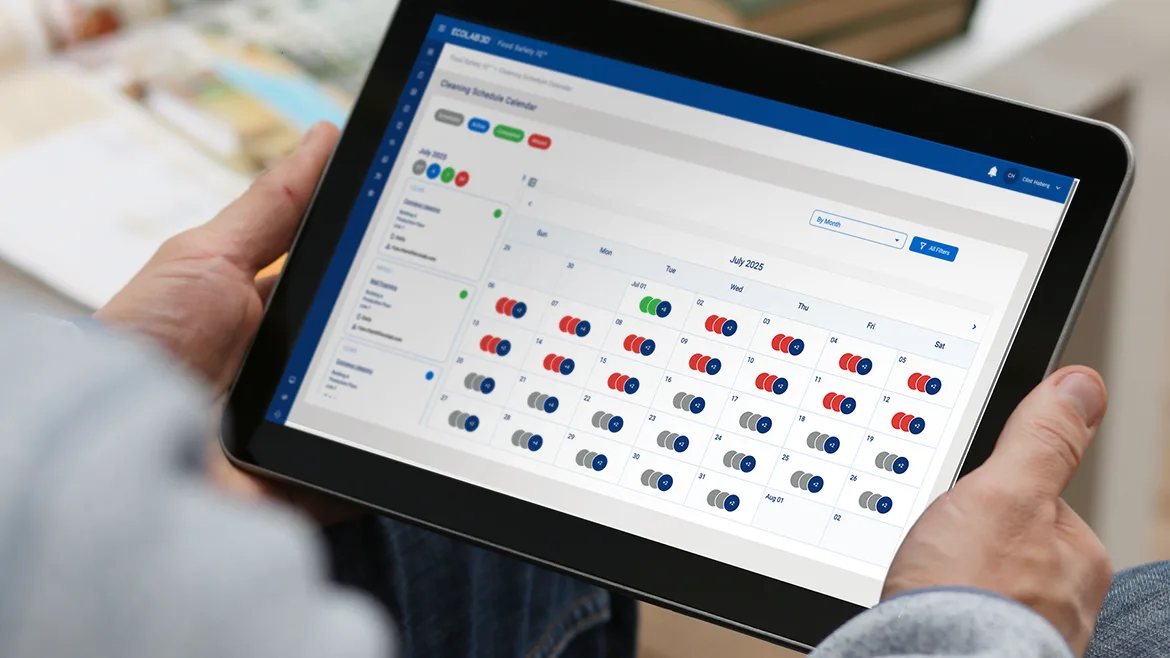
Ecolab’s Food Safety IQTM Cleaning Schedule Calendar keeps track of who is responsible for cleaning certain areas and equipment.
Ask a sanitation consultant that’s helped prepare food and beverage companies for regulatory inspections and you’ll hear a familiar story. Even with some of the larger food companies, their officials will dig through loose papers, notebooks and spreadsheets to come up with proof that their plant is ready for an unannounced inspection. However, paper and digital records are scattered everywhere. How long will it take to come up with a report? Not minutes or the same day. Maybe a week or two — or three is more realistic.
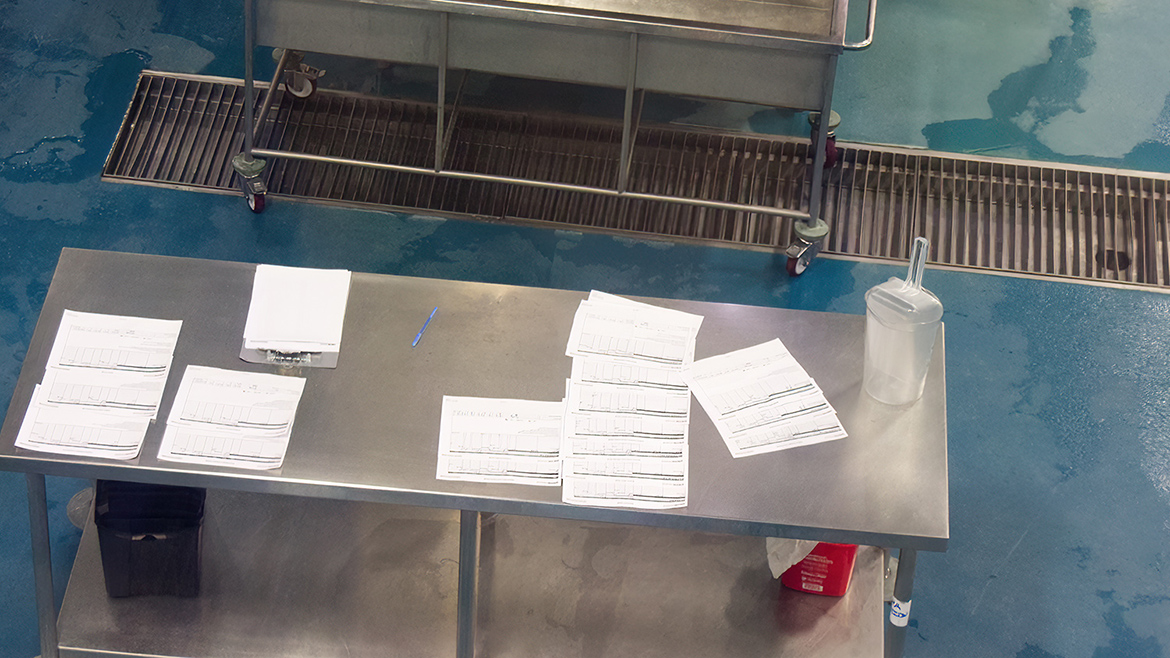
Still doing paper records for production and sanitation? Maybe it’s time to commit to electronic production and sanitation records, making it easier to spot potential problems. Image courtesy of Wayne Labs
Stop Hodge Podge, Helter Skelter
But it doesn’t have to be this way. “Software gives sanitation teams the ability to connect information that would otherwise sit in separate systems,” says Dan Abramson, Syspro SVP Americas. “A failed ATP test or an environmental positive becomes much more meaningful when it’s viewed alongside maintenance records, production history, quality inspections and lot traceability. By bringing those operational data points together, manufacturers gain a more complete picture of what’s happening across the plant. As more manufacturers apply AI and machine learning to operational data, those systems can also help identify recurring patterns or anomalies that may warrant investigation before they become larger food safety issues. It’s about giving people better information so they can make better decisions.”
“Sanitation management is the glue that holds the food safety system together,” says Bob Burgh, VP, software development, Hygiena. “Its job is to turn sanitation from simply being a compliance checkmark into a diagnostic activity. A single positive result is a data point, but a pattern of failures on the same line, shift or team is a diagnosis. By tracking results and identifying trends, facilities can continuously improve their sanitation plans and mitigate risk.”
Sanitation companies like Sani-Matic not only offer cleaning equipment but also have software to track the efficacy of the cleaning process. For example, according to Pete Barrie, director of product and marketing, Sani-Matic has a full line of COP, CIP and hygienic component solutions (e.g., spray devices, strainers) to help customers improve and speed up their sanitation processes.
“Our data and analytics products in parallel record and track not only cleaning data (e.g. time, temperature, conductivity, flow) for FDA compliance but also operational data to help monitor and improve their process,” Barrie says.
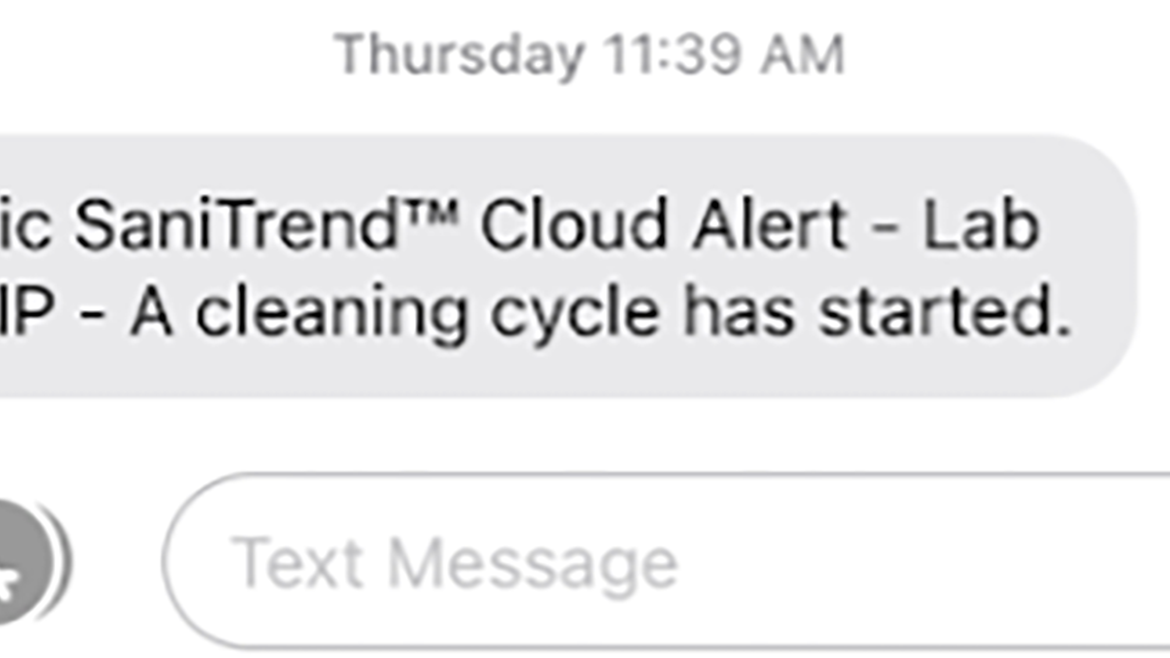
SaniTrend Cloud Cleaning Reports (CR) Text Message Alerts helps to optimize sanitation workflow. Image courtesy of Sani-Matic
“As we look toward using AI to help make better decisions, data integrity matters,” Barrie adds. If data is incomplete, difficult to access or not consistently captured, AI won’t be capable of delivering usable insights. Sanitation records should include critical information such as cycle start/stop times, temperature, flow, pressure, chemical concentration, conductivity, rinse performance and cycle completion status as well as operator actions, alarms and deviations.
Ecolab offers a comprehensive cleaning and sanitation (C&S) partnership with its processor clients, providing everything from chemistry, equipment, digital solutions and continuous consultative service at every C&S touchpoint, including CIP, says Hyun Mee Graves, Ecolab VP commercial transformation.
“The depth of our offering lends us insight into what’s working and what’s not in the world of CIP,” Graves adds. “And one of the biggest food safety-related issues we help with involves building (and maintaining) comprehensive visibility into CIP processes.”
People are adopting digital tools in record numbers, but only 30% of food and beverage leaders are getting actionable insights from their CIP data, Graves adds. That gap — between the data available and what staff can do with that data –– can slow operations down and contribute to risk. Food safety concerns slip through the cracks, and the task of chasing after food safety issues becomes less efficient.
When solutions and processes are disconnected, CIP can devolve into a tangle of missed opportunities. But when CIP is integrated and handled comprehensively, it can help create a stronger, more reliable food safety foundation, Graves says.
One company that has brought together testing products and added sanitation software to its offerings is Hygiena. According to Burgh, Hygiena has a closed loop approach to sanitation verification and execution. “As a leader in ATP hygiene monitoring through our testing swabs, EnSURE Touch Luminometer and SureTrend Data & Analytics software, we provide sanitation teams with verification results in seconds. We recently acquired KLEANZ software for sanitation execution and management, giving us a rare combination of testing hardware that tells you whether a surface is clean and software that tells you whether the sanitation program itself is properly executed, documented and improving over time. Our deployment teams include PCQI-certified and ANSI z50 affiliated members that make implementation a more deliberate food safety rollout.”
CIP Software Identifies Trends
Today, CIP suppliers usually provide software as well as equipment. “Our SaniTrend Cloud software allows for comments on each individual cleaning cycle –– processors are utilizing this to electronically record batch numbers, ATP results, swab tests, etc., which can be reviewed historically to see if there are trends (e.g., happening on a certain line, during a certain shift),” says Sani-Matic’s Barrie.
“Far from being just another box to check, tracking trends in food safety data is critical to establishing food safety as an institutional value,” says Ecolab’s Graves. When organizations get a positive ATP swab on a drain, for example, it’s dangerous to assume that’s an isolated event. The purpose of digital monitoring solutions does not stop at identifying and logging a nonconformance event; the purpose is to identify harborage hot spots and stop bacteria and biofilms before they turn into a recall.
“The fundamental purpose of cleaning and sanitizing software is to take the data at manufacturers’ disposal and make it as useful as possible,” Graves adds. “It’s a deceptively simple mandate, but one that a lot of digital solutions fall short of.”
Think about that positive ATP swab on a drain, for instance. By analyzing results over time, and by integrating with other food safety-related digital monitoring tools, digital ATP logs should be surfacing potential problem areas on the factory floor, providing direction for diagnosing the root of the problem and translating those findings into actionable remediation plans, Graves adds. Is a component consistently falling short of cleaning and sanitization standards? Is the contamination problem related to how traffic flows through the production line? When the answers to these questions are easily accessible through a centralized digital source, teams can get back to work faster and support long-term food safety improvements that prevent avoidable failures.
“I think that, in many ways, food safety teams have gotten used to expecting too little from their digital investments,” Graves says. “But the right tools are out there, and the advanced insights they provide can help flag, diagnose and fix an issue before it ever gets the chance to drag production to a halt.”
AI tools accelerate and deepen these insights, which is quickly making production data even more accessible and valuable to every role, from the plant to corporate, Graves says.
Integrated Sanitation and Maintenance History Key to Solving Problems
The industry has learned that a holistic view of food safety is important, says Hygiena’s Burgh. Everything from the HACCP, sanitation execution, testing, equipment maintenance, team member training and third-party compliance inspections all matter. Biofilm and harborage points are frequently a maintenance story as much as a cleaning story. If your sanitation software can’t see maintenance history, you’ll only keep recleaning a surface that needs to be fixed. A recurring positive on a piece of equipment can be cross-referenced against when it was last serviced to understand the root-cause of the result.
Just as Burgh pointed out, maintenance and sanitation are closely connected, even if they’re often managed separately, says Syspro’s Abramson. If the same asset repeatedly shows sanitation or quality issues, maintenance history can help identify underlying causes such as worn components, recurring repairs or equipment that needs attention. When that information is connected, manufacturers also build a stronger data foundation for predictive analytics, making it easier to spot recurring equipment issues before they affect production or product quality. Bringing those records together helps operations, maintenance and quality teams make more informed decisions, all while creating a shared view across functions and reducing information silos.
“Cleaning and sanitation data must be fully integrated and centralized within one platform. It’s that simple, but it’s not as common as it should be,” says Ecolab’s Graves.
It’s often the case that food and beverage manufacturers already have all or most of this data at their disposal. The problem is it’s dispersed across different systems, logged in different formats, and built from incompatible data elements.
Data is chatty — it wants to communicate with other data and use that conversation to generate recommendations you can use to improve food safety, drive better efficiency and achieve sustainability goals, says Graves. But without an integrated system capable of deriving real insights across different systems, all that chatter is just noise.
With this data, OEE can be used as a key performance indicator (KPI), which can help expose potential maintenance issues. “We calculate OEE for our cleaning cycles with our SaniTrend Cloud CR product, which eliminates the need for paper chart recorders or other additional hardware and helps to meet FSMA and HACCP requirements for reporting, says Sani-Matic’s Barrie. The software interfaces with a Sani-Matic cleaning system’s programmable logic controller (PLC) to collect, store and organize cleaning wash cycle data. Users can access cleaning cycle information through live dashboards and cycle-based reports, making it easier to review, comment on, approve and share cleaning documentation from any location with an internet connection.”
“We also monitor valve cycles and run time through a preventive maintenance (PM) tracking system for a more informed maintenance program,” Barrie adds.
How AI Works with C&S Systems
AI adds a second layer to C&S software by analyzing data for non-obvious correlations — such as repeat positives after certain production schedules, recurring failures on specific assets or contamination clusters linked to maintenance or moisture events. AI helps prioritize sampling, teardown inspections or corrective actions before a persistent biofilm problem turns into a food safety event.
“We believe that the first step is data collection and have focused on that,” says Sani-Matic’s Barrie. “However, we are actively looking into AI integration with our cloud system to better present and conceptualize the data for our customers.”
When sanitation records are kept manually using paper records, it’s more difficult for AI to analyze this data. Therefore, Sani-Matic has emphasized that digital sanitation records give manufacturers a stronger foundation for reporting, analytics and continuous improvement — and also serve as a foundation to AI-based systems.
AI takes the data analysis that advanced digital platforms are already doing — flagging repeat positives, recurring failures on specific assets, etc. — and makes it possible for cleaning and sanitation professionals to do more with that information, faster, says Ecolab’s Graves.
“At Ecolab, this level of AI-enhanced monitoring and troubleshooting is extending the reach of our service,” Graves continues. “For decades, our experts have been helping manufacturers meet food safety goals while also supporting better efficiency, productivity and water management. Now, they can accomplish this at scale and in real time. AI surfaces and prioritizes insights, accelerating troubleshooting and putting new opportunities within reach faster.”
This approach achieves better results across different priorities and across different sites. No longer do manufacturers need to settle for varying levels of performance across their facilities; AI-enhanced cleaning and sanitation service makes it possible for every facility to be their best facility.
“Unlike previous generations of monitoring tools, the most recent generation uses machine learning to cater their findings to your facilities more and more over time,” Graves says. “They’re literally learning your operations, providing more targeted insights and recommendations with each passing CIP cycle, ATP swabbing cycle, etc. That helps experts deliver hyper-focused, actionable guidance, which in turn gives the machine learning model more useful information, and so on. It’s a really powerful positive feedback loop, one that will probably define the next generation of advanced cleaning and sanitation.”
However, AI is only as good as the data feeding it, which is exactly why the consolidation work we’ve discussed earlier has to come first, says Hygiena’s Burgh. You can’t correlate a drain positive with a production schedule or a maintenance event if those three data sets live in three different systems.
“We’ve started integrating AI directly into SureTrend and KLEANZ as an assistant that can query years of historical sanitation data on demand,” Burgh says. “One of our clients, a large confectionery manufacturer operating more than 30 facilities, uses it to gain cross-site insights, such as which locations are trending up or down year over year. They receive a quick answer in plain language without needing to build a custom report.”
“More future-looking, the goal is to move from retrospective to predictive, using ATP trends, production schedules and maintenance backlogs to know what is at elevated risk,” Burgh says.
Further reading
“Fighting the Foodborne Bacteria War with Cleaning and Sanitation,” FE, May, 2025
“Looking Toward Water-Smart Cleaning and Sanitation,” FE, May, 2026
“Develop a Risk-based Approach to Sanitation,” FE, May 2024
Looking for a reprint of this article?
From high-res PDFs to custom plaques, order your copy today!